Comparing Crop Surveys Across Dates and Seasons with Appropriate Context
Build comparable crop monitoring through stable parcel identities, growth-stage records, consistent acquisition, calibration, geometric checks, and field verification.
Define the change management needs to understand
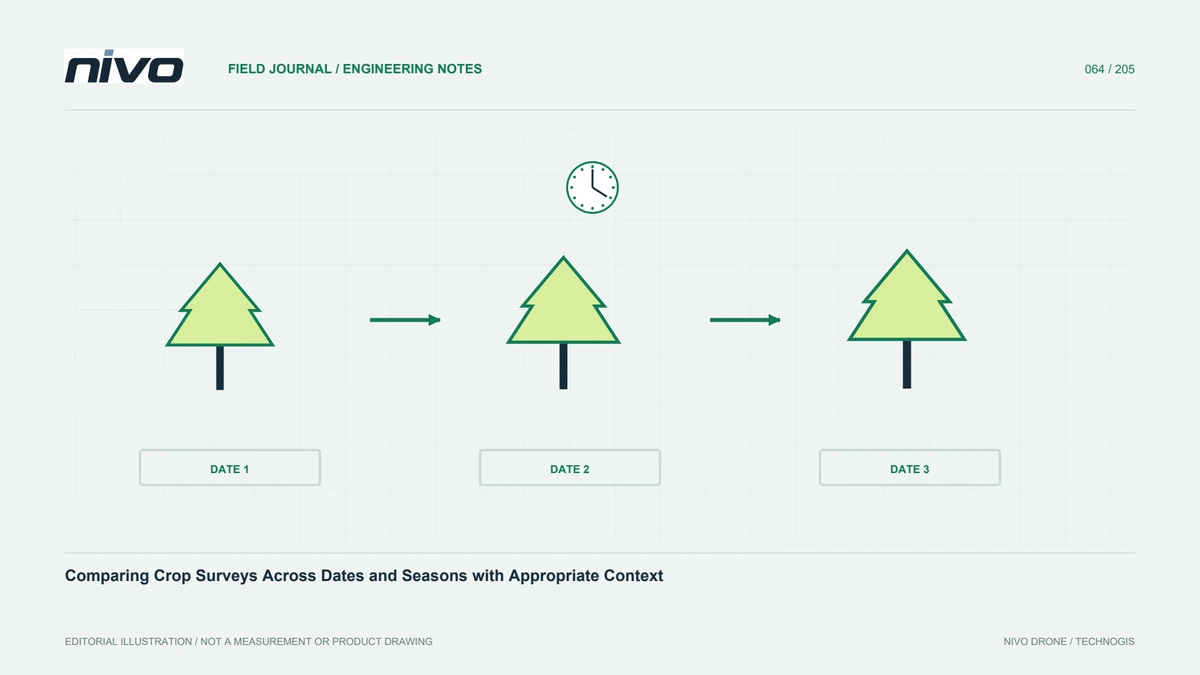
Start repeated monitoring with a meaningful change question: cover development, differences between blocks, or evaluation after a management action. Not every color difference matters to the same decision. Define observation units, periods, and supporting evidence before scheduling flights. This distinguishes the intended change from variation introduced by season, lighting, or methods. A useful program is a sequence designed to answer a question, rather than an accumulation of differently dated maps whose visual differences cannot be interpreted consistently by the people managing the crop.
Keep parcel and comparison-area identities stable
Retain field boundaries, block numbers, varieties, planting dates, and treatments throughout the series. Preserve boundary history when parcels change so statistics do not unknowingly compare different areas. Choose comparison areas that help explain general conditions and natural variation. A treatment block cannot be evaluated from a value difference without relevant context elsewhere. Connect field notes to the same spatial identities each period. This helps determine whether a pattern follows management, changing cover, or simply a change in the area included in the calculation.
Record growth stage and field events
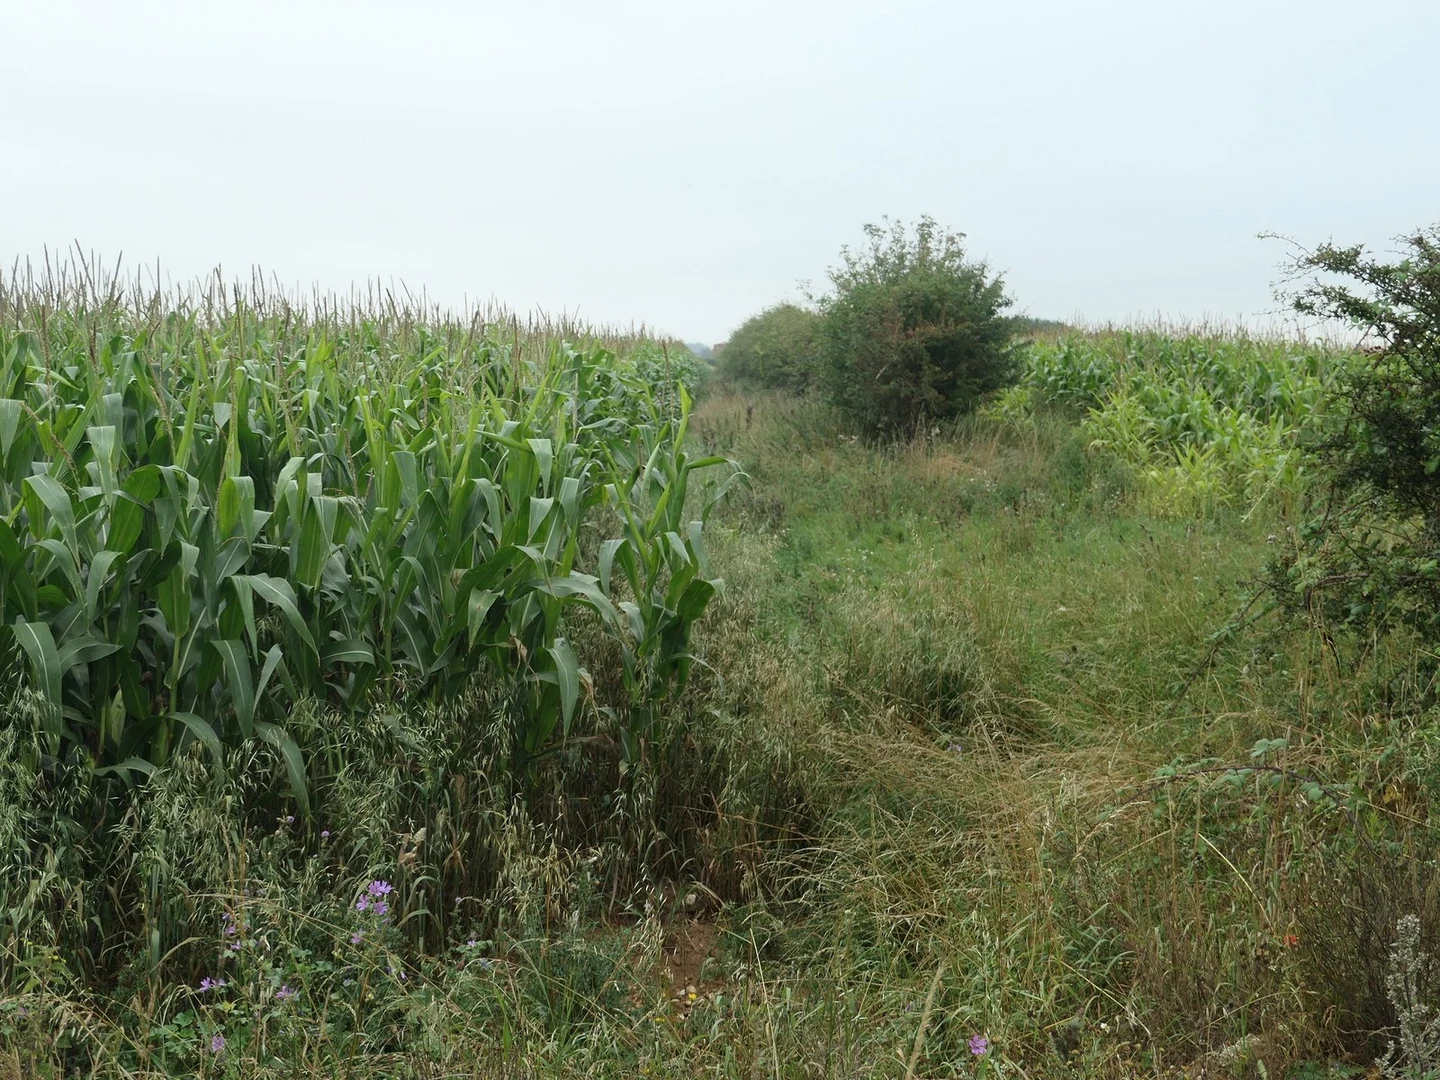
Crops naturally change during growth, making dates alone insufficient context. Record development, harvests, replanting, irrigation, and relevant management events. These observations help explain differences between neighboring parcels. Separate analysis or state limitations where crops and ages are mixed. The same sensor and formula do not make all parts of a farm directly comparable. Event records also guide useful future timing. A schedule responding to management questions can provide more relevant information than a fixed interval chosen without regard to crop dynamics or decision opportunities.
Repeat acquisition without hiding real differences
Keep sensor configuration, coverage design, and procedures reproducible, but do not assume an identical route proves equivalent quality. Review changes in equipment, firmware, lighting, wind, and canopy condition each time. Retain enough metadata to evaluate them. Test replacement equipment before treating old and new observations as equivalent. Consistency aims to reduce method changes that obscure plant changes, not force results to look alike. It gives observed differences a stronger explanatory foundation and reduces uncertainty about whether a pattern belongs to the field or the acquisition system.
Apply calibration discipline at every visit
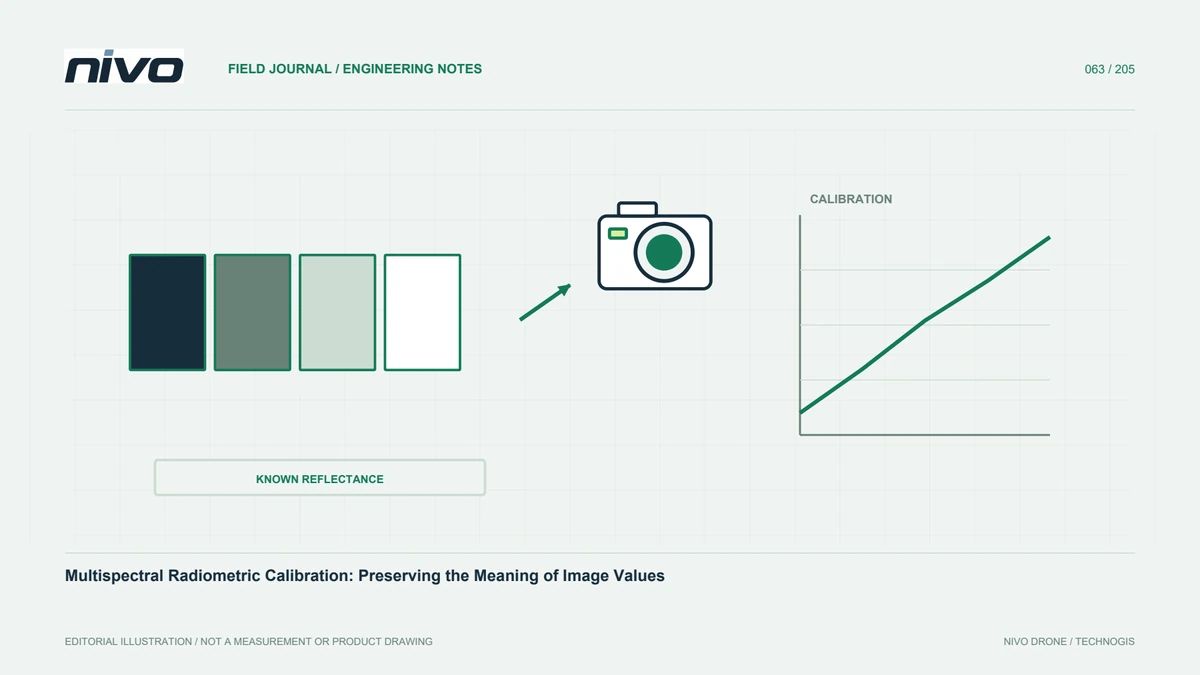
Carry out the device-appropriate radiometric procedure throughout the monitoring series. Verify that references, panel images, metadata, and light observations are complete and correctly associated with each flight. One calibration event should not be assumed sufficient for a whole season. Check supporting files on site while repetition remains possible. Retain processing parameters and versions. When improving a workflow, consider consistent reprocessing of comparison data while preserving prior outputs and change notes, so the analytical history remains understandable rather than silently replacing the earlier basis of interpretation.
Check geometry before calculating differences
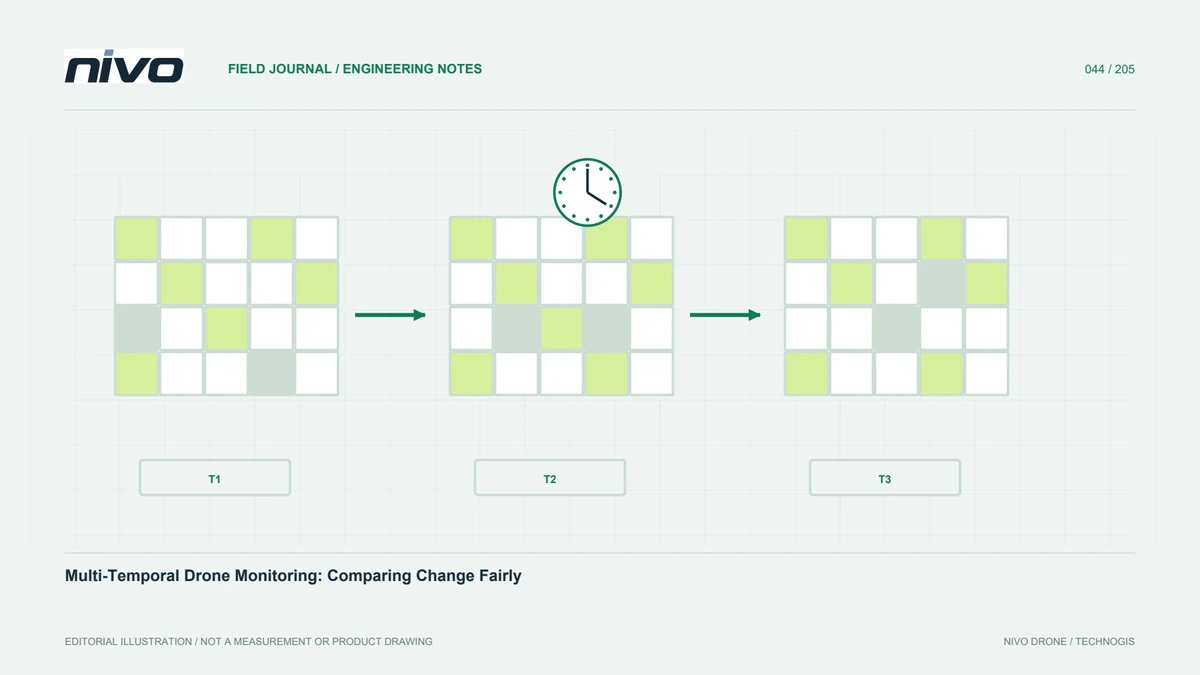
Pixel or zone comparison requires suitable spatial correspondence between periods. Small shifts can create apparent change along canopy edges, roads, or drains even when nothing has changed. Inspect stable features and use consistent reference systems. Explain resampling where output grids differ. Preserve the transformation and clipping history. Parcel statistics can suit some decisions but do not automatically resolve every geometric issue. Match the analysis method to object size and the question, testing sensitive areas before applying a difference calculation across the entire project.
Use legends that support comparison
Automatic legends can make every map look contrast-rich while making time comparisons misleading. If a color represents different values on different dates, recipients may infer a false trend. Provide explicit class definitions and numerical ranges. Explain when classes are relative to each dataset rather than fixed between periods. Parcel graphs can complement maps by showing values with dates and context. This lets readers distinguish genuine changes in the measured response from changes caused only by how the results have been styled for presentation.
Verify explanations through field observations
Visit locations representing large differences, small differences, and apparently stable areas. Compare observations with management history and acquisition conditions. Do not select only places supporting the initial hypothesis. Retain conflicting as well as supporting evidence. When evaluating a treatment, consider other factors that changed over the same period before claiming causation. Consult people familiar with the crop and local management. Aerial data provide spatial breadth; direct observations help explain meaning. Their combination supports stronger interpretation than a difference in one index alone.
Archive decisions and follow-up actions
Store the series alongside parcel maps, acquisition conditions, processing methods, field visits, and subsequent decisions. Record whether recommendations were implemented and when. Use that history as context for the next observation. Assess whether the monitoring interval captures the changes that matter. Persistent unanswered questions may require redesign or additional information rather than simply more maps. A well-organized archive turns repeated surveys into growing knowledge, helping managers explain change and choose the next action while keeping uncertainty and data boundaries visible.
Illustrative case: comparing parcels after a boundary change
Imagine a hypothetical monitoring program that reports average crop-index values for the same named parcel each month. After several visits, the manager sees a sudden change and asks whether a recent treatment caused it. The analyst first checks the spatial records and finds that the parcel boundary was edited after part of the field was replanted. The name stayed unchanged, but the area contributing to the average did not. Comparing the two summary numbers directly would therefore combine a biological question with a change in the reporting unit.
The team preserves the boundary history and prepares a comparison over an explicitly defined common area, while documenting the excluded portion and its planting history. It also reviews calibration, acquisition conditions, and processing consistency before interpreting the remaining difference. Field observations are selected from the replanted zone, the common comparison area, and a relevant reference block. The report separates observed change from any claim about treatment effects and records other management events occurring between dates. Future deliveries include boundary version and crop stage beside every parcel statistic. This hypothetical example illustrates why repeated monitoring needs stable identities linked to spatial history, rather than assuming that an unchanged parcel name guarantees a comparable observation.
The decision meeting contrasts evaluating the unchanged portion of a parcel with evaluating the new parcel as a different reporting unit. Both may be useful, but they answer different questions and must not share an unexplained time-series label. Handover includes maps of the old, new, and common areas, along with boundary-version identifiers and calculation notes. A future analyst should be able to reconstruct which pixels entered each statistic. That criterion makes the comparison auditable and preserves the replanted area's importance without allowing its changed membership to distort the interpretation of the rest.