MicaSense for Crop Monitoring: From Field Questions to Useful Maps
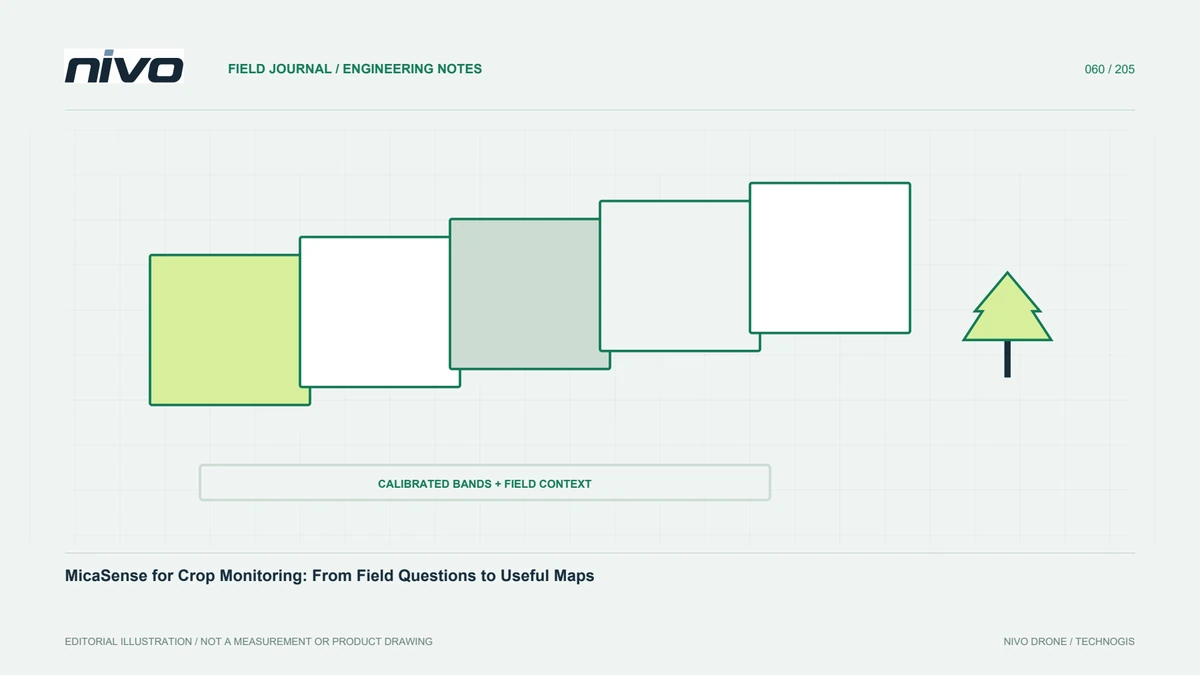
Plan crop monitoring with MicaSense by connecting specific agronomic questions, confirmed sensor configurations, calibration, processing, field verification, and usable reporting.
Start with a specific agronomic question
Multispectral monitoring is more useful when aimed at a defined question: growth variability, irrigation patterns, differences between blocks, or locations needing field visits. An index map does not independently explain why a crop differs. Involve the farm manager or agronomist early so the area and timing matter to management. A specific question defines supporting observations, reporting, and evaluation. The camera becomes one observation tool within a decision process, rather than a replacement for field knowledge, additional measurements, or qualified interpretation.
Confirm the exact sensor configuration
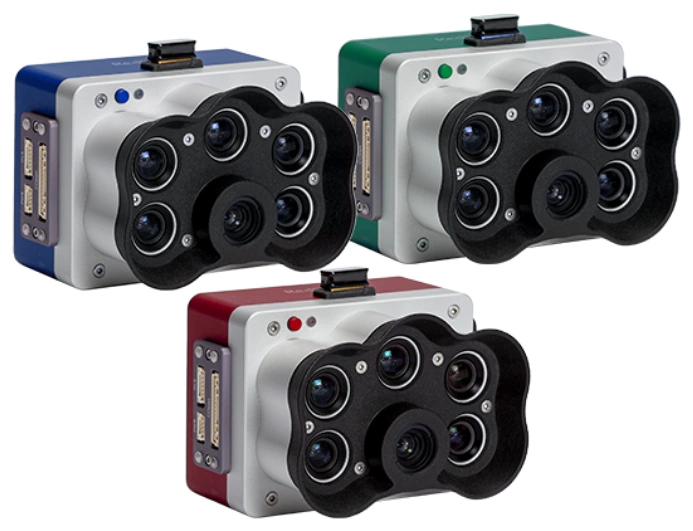
MicaSense includes different device families and arrangements. A brand photograph or family name does not establish every capability of the installed unit. Record model, device identity, relevant optics, firmware, panel, and light-measurement components. Use official documentation for that configuration and do not transfer specifications from a similar-looking model. When discussing a NiVO payload, confirm what is supplied and how it is integrated. Clear device identity helps processors choose suitable methods and prevents mistaken comparisons between equipment, seasons, or projects.
Design meaningful area and timing comparisons
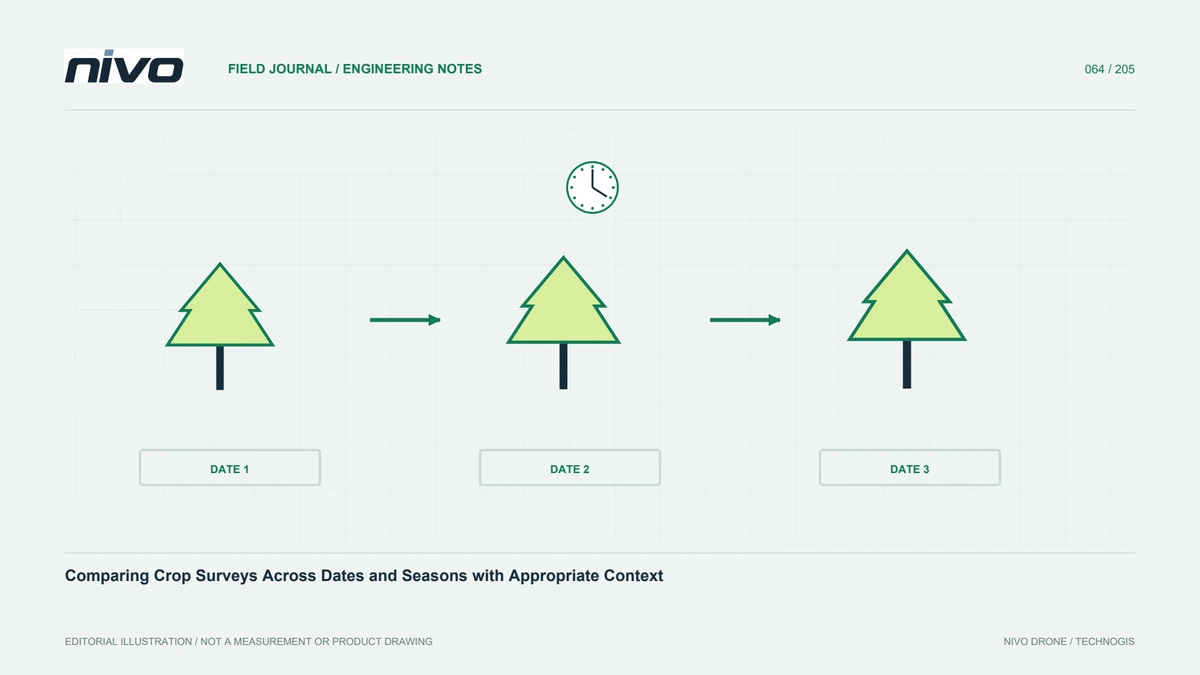
Define crop blocks, age variation, access routes, and different management treatments. Include enough surrounding context to interpret patterns, not just the area suspected to be problematic. Retain block identities and growth stages for repeated work. Consider illumination, moving canopy, and field changes when scheduling. Follow sensor and processing guidance for overlap and acquisition design instead of treating one number as universal across crops. A small trial can demonstrate whether the plan supplies the coverage and detail needed before the main monitoring campaign begins.
Apply calibration appropriate to the device
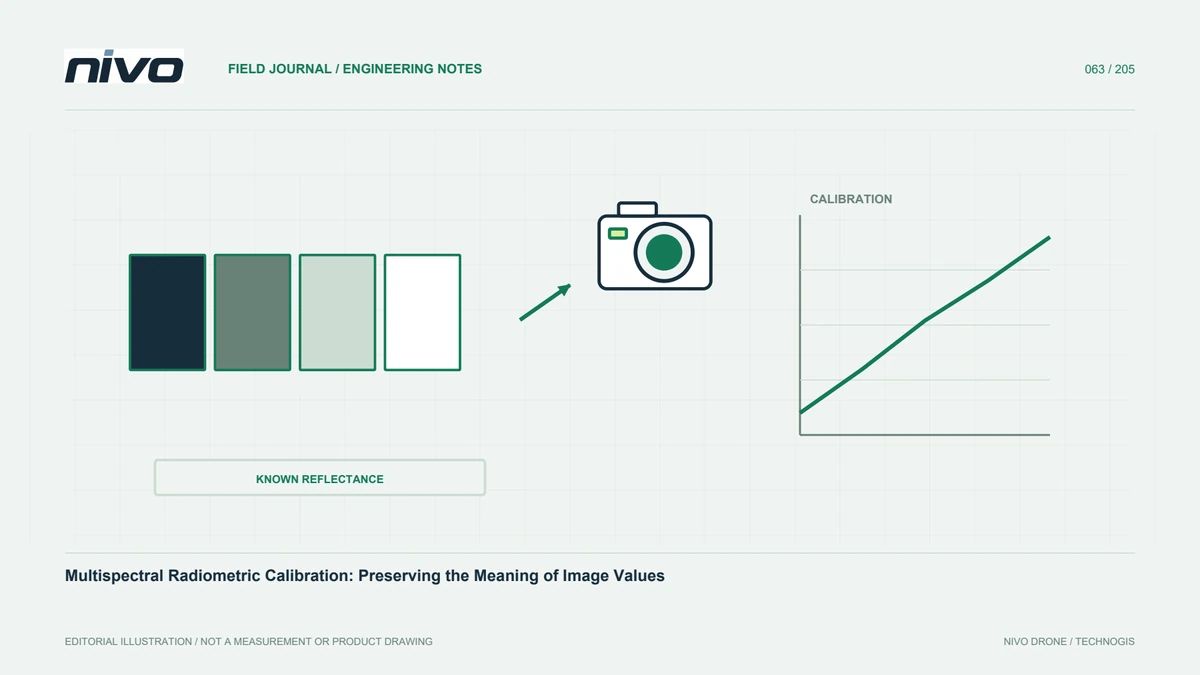
Radiometric calibration supports more meaningful comparison of sensor response. MicaSense guidance explains panels and relevant metadata for its workflows. Treat the panel as a maintained measurement component, verify its identity, and capture it according to the applicable guidance. An available light sensor is not a reason to ignore panel procedures. Record conditions and retain original calibration files with flight images. If supporting data are incomplete, disclose the limitation before the analyst uses results for comparisons between dates, blocks, or management treatments.
Check bands and metadata for completeness
After flight, confirm the required image sequences and channels are present. Check capture identities, timestamps, and metadata needed by the processing tools. Avoid arbitrary renaming where relationships between bands depend on dataset structure. Preserve verified copies of original files. Inspect samples from the beginning, middle, and end for exposure issues or recording failures. Field review leaves an opportunity to repeat acquisition while access remains available; discovering missing data only after media have been reused can greatly restrict the available remedies.
Separate geometric and spectral processing checks
A multispectral dataset needs both positional alignment and meaningful pixel values. A neat-looking map does not prove correct radiometric processing, and suitable value corrections still need band alignment at object boundaries. Record software, version, parameters, and calibration inputs. Check canopy edges, roads, and strong spectral contrasts for misalignment. Review seams when combining blocks captured under different conditions. Treat geometry and radiometry as separate checks so that a convincing orthomosaic appearance is not mistaken for proof of every aspect of analytical quality.
Interpret indices with field context
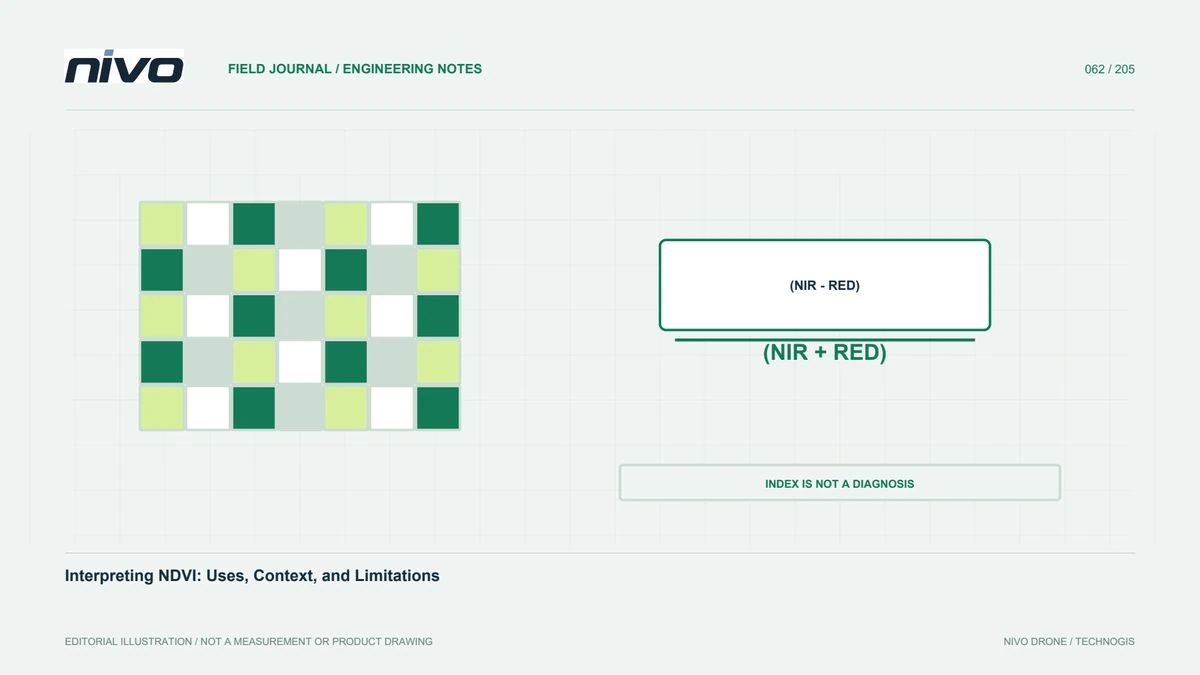
Indices can highlight patterns that are difficult to recognize in RGB, but they do not uniquely diagnose a cause. Compare differences with crop age, soil cover, water conditions, varieties, and direct observations. Visit several value classes, including apparently normal areas as controls. Record observations with stable location identities and dates. Involve agronomic expertise when findings will support management recommendations. An actionable result should distinguish the observed pattern, supporting evidence, and remaining investigations rather than assigning a disease or nutrient explanation to a color automatically.
Present outputs around management decisions
Recipients need connections between maps, locations, and field actions. Include block boundaries, a clear legend, acquisition date, processing method, and areas prioritized for checking. Do not label colors as specific crop problems without supporting verification. If classes are relative within one field, explain why they should not be compared blindly with another field's classes. Link recommended inspection areas to image or field evidence. Clear presentation lets managers judge usefulness and provide feedback that improves the monitoring design rather than merely receiving attractive imagery.
Build a traceable observation series
Retain the relationship between equipment, configuration, calibration, crop stage, and field findings. Mark procedural changes so analysts do not mistake method differences for biological changes. Use consistent naming and quality records. Over several periods, assess whether maps actually improve inspection planning or treatment evaluation. Unanswered questions may require a different design or additional information. Start a NiVO MicaSense discussion from those objectives and the available configuration. Monitoring investment should support better documented decisions, not simply an increasing collection of spectral maps.
Illustrative case: separating growth-stage differences from a crop concern
Imagine a hypothetical farm manager receiving a MicaSense-derived map in which one block appears different from its neighbors. The initial request is to label that block as unhealthy and send it directly to an application team. Instead, the analyst checks parcel records and discovers that planting dates and management histories are not yet attached to the imagery. The team also confirms the actual sensor configuration and calibration files, because a family photograph in an equipment list does not establish how this dataset was collected or processed.
A field visit is planned across the contrasting block, a similar-age comparison area, and a zone that appears ordinary on the map. Observers record crop stage, cover, water conditions, and relevant management events without treating the index as a diagnosis. If age differences explain part of the pattern, the report separates that observation from any remaining concern needing agronomic review. The final deliverable links each proposed follow-up area to its parcel identity, source imagery, and field evidence. It also explains whether displayed classes are relative within this dataset. This scenario illustrates how a multispectral map can guide a better investigation without becoming an automatic prescription or an unsupported statement about the cause of crop differences.
Two follow-up choices are documented: inspect an unexplained zone promptly, or first correct the comparison design where crop stages differ. The report does not treat either choice as a treatment recommendation. Handover requires parcel-linked field notes, the version of the index map actually reviewed, and a clear statement of who will assess the remaining agronomic question. A manager unfamiliar with the flight must be able to locate the zone and understand why it was selected, including why a nearby comparison area was included rather than omitted from the investigation.