Understanding Photogrammetric Point Clouds for Geospatial Analysis
Learn how image-derived point clouds are formed, which attributes to retain, and how to check density and geometry before creating analytical products.
Understand the observations behind the points
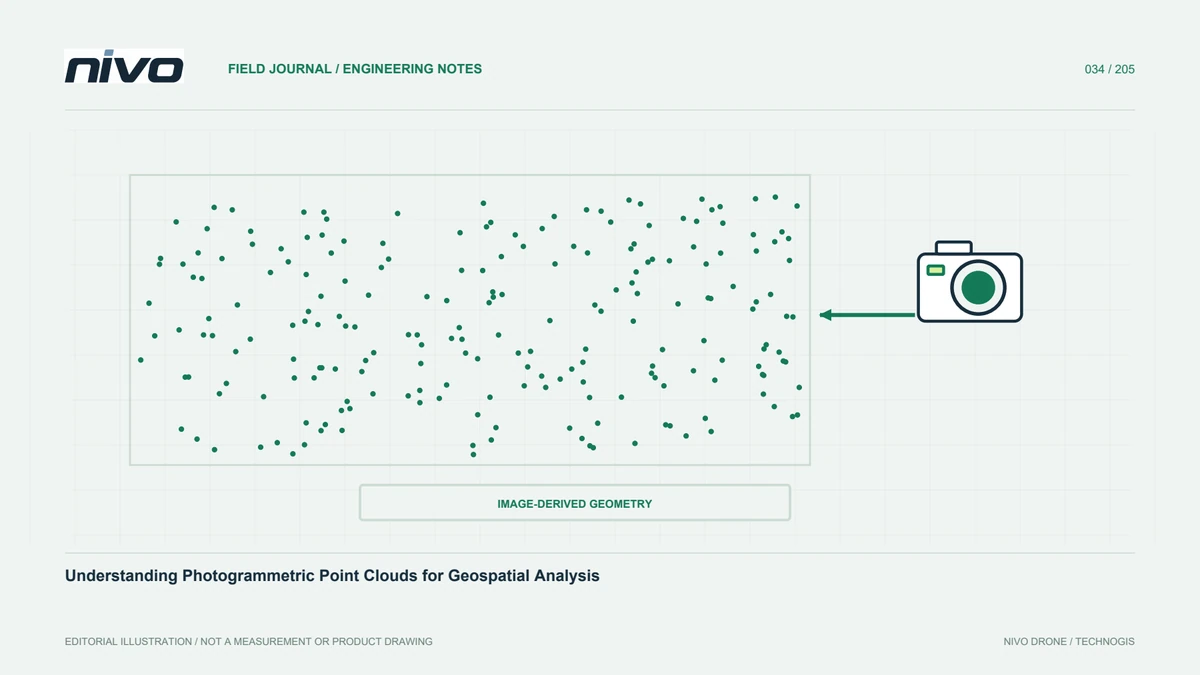
A point cloud describes space through many three-dimensional coordinates. In photogrammetry, relationships between images viewing the same surface from different positions generate those points. Image colour can make the result look like a realistic site replica, but appearance does not establish uniform geometric quality. Some surfaces have many useful viewpoints; others have very few. Understanding this difference helps assess whether a cloud can support elevation modelling, meshes, object measurement, or documentation. Start by identifying its source and reconstruction history rather than treating a large point count as the main evidence of quality.
Separate orientation support from dense reconstruction
Photogrammetric workflows commonly use an initial representation to support camera orientation and a denser reconstruction to describe surfaces. These serve different roles. Weak alignment can affect later stages, so increasing density does not necessarily solve the underlying problem. Check connected cameras, feature distribution, and overall block shape before expensive processing. Retain initial reports for comparing changes. If dense reconstruction contains gaps, investigate texture, viewing angles, and image quality before filling them. Undocumented interpolation can make a model look complete while concealing observations the cameras never supplied.
Recognise difficult surface behaviour
Water, glass, reflective materials, moving foliage, and uniform colour may not provide stable visual relationships. Objects moving between exposures can create displaced points or incomplete forms. Building sides invisible from a nadir route may be absent even when roofs look good. Address such conditions in acquisition planning so additional views or checks can be considered early. Not every hole is a software failure; some reflect unavailable source information. Distinguish capture limitations, processing choices, and object properties. That diagnosis is more useful than repeatedly increasing reconstruction settings without changing the evidence available.
Preserve coordinates and useful attributes
Export should retain the reference framework, height system, units, and attributes users need. Colour, classification, and other information can disappear when formats or export settings change. Test recipient compatibility with a sample and compare point count, extent, and position with the original project. Document reprojection rather than changing a CRS label to make layers appear aligned. QGIS provides source and attribute information useful for inspection; dedicated tools can support transformations or edits where needed. Record those operations so recipients know which version they are using and what changed between source and deliverable.
Assess density spatially
An average density can hide sparse or empty areas. Inspect distribution by grid or relevant zones, and distinguish total density from observations useful for a particular task, such as candidate ground points. Around roofs, slopes, and canopy, point arrangement may matter more than the average. Consider viewing geometry and the feature size to be measured. A dense cloud on the wrong surface does not improve positional quality. Relate density to intended products and assessment results, then identify weak areas so users do not assume equal support across the entire project because one headline figure appears impressive.
Remove disturbances without erasing real features
Filtering can reduce isolated or implausible points, but aggressive cleaning may also remove thin objects, roof edges, and genuine terrain detail. Preserve the source and test representative samples before filtering everything. Compare cross-sections before and after the operation. Do not delete difficult areas merely to produce a smooth display. Record how noise labels or exclusions were determined, since another analysis may still need the original observations. A repeatable workflow allows later discrepancies to be traced to specific filtering decisions instead of leaving users to infer changes from a cloud whose processing history is missing.
Explain assumptions in derived products
Surface rasters, meshes, profiles, and extracted features all add choices to the source cloud. Relevant decisions include selected point classes, interpolation, and grid size. A raster cannot be justified solely by saying it came from a dense cloud. Inspect point selection and treatment of missing areas. Volume measurement depends strongly on base-surface and boundary definitions, while communication meshes may be simplified for user hardware. Preserve links between every derivative and its source version. When a result changes, the team can then identify the processing decision responsible rather than guess from similarly named files.
Use profiles and independent references
Three-dimensional views reveal overall form, but profiles often expose doubled surfaces, waviness, and block shifts more clearly. Select them across joins, slopes, and stable features relevant to the project. Use suitable independent checkpoints where positional quality is part of acceptance. Control points alone are not independent proof. Save check images with identifiable locations so others can repeat the review. Explain whether a finding is local or affects the wider block. This gives users a defensible basis for acceptance, correction, or limited use instead of relying on an attractive overview.
Package the cloud for different users
Provide the main cloud, an appropriately labelled review copy where useful, valid coverage, and an attribute summary. Analysts can use the required detail while project staff inspect a lighter version. Explain coordinates, units, file sizes, and existing derivatives. Identify poorly observed water or building sides spatially. NiVO RGB acquisition supports the observation stage, but the cloud's ability to answer project questions still needs this checking workflow. A clear handover prevents confusion between complete, filtered, classified, and simplified representations, preserving both usability and the evidence needed for technical review.
Illustrative scenario: cleaning removes a useful thin structure
Imagine a hypothetical facility model containing a narrow fixed framework beside a building. The source cloud shows it incompletely but recognisably. After aggressive cleaning, the review copy looks smoother, yet much of the structure disappears. The processor compares the same profile before and after filtering rather than assuming the cleaner view is more accurate. Source images confirm the feature is real, while uneven observations explain its vulnerability to the operation. The team records the region and asks whether this feature matters to the agreed product. Its relevance determines the next quality action rather than an aesthetic preference for a tidy display.
A revised filter is tested on representative thin objects and ordinary surfaces before wider use. The original remains available, and main data is separated from a simplified presentation copy. The report explains which representation supports each use and where measurement of the partially observed framework is limited. If dimensions are important, a suitable verification method is requested instead of reconstructing missing shape from appearance alone. This hypothetical case illustrates why fewer isolated points are not automatically an improvement: a cleaning decision can remove genuine information that another analysis needs, even while making the overall model look more polished.
The acceptance discussion compares the benefit of reduced noise with the loss of the particular feature users need. A cleaning setting is accepted only when its effect has been reviewed against that requirement. The handover identifies the unfiltered source, the approved working cloud, and any presentation-only derivative. It includes the same before-and-after examples used during review. A recipient can then choose the appropriate representation and avoid measuring a simplified copy merely because it loads faster or appears smoother on an ordinary laptop.