Slope in Degrees or Percent: Units and Analysis Scale
Define slope units, horizontal and vertical scaling, surface choice, and neighbourhood size before comparing terrain classes or applying an engineering screening threshold.
Separate angle from gradient
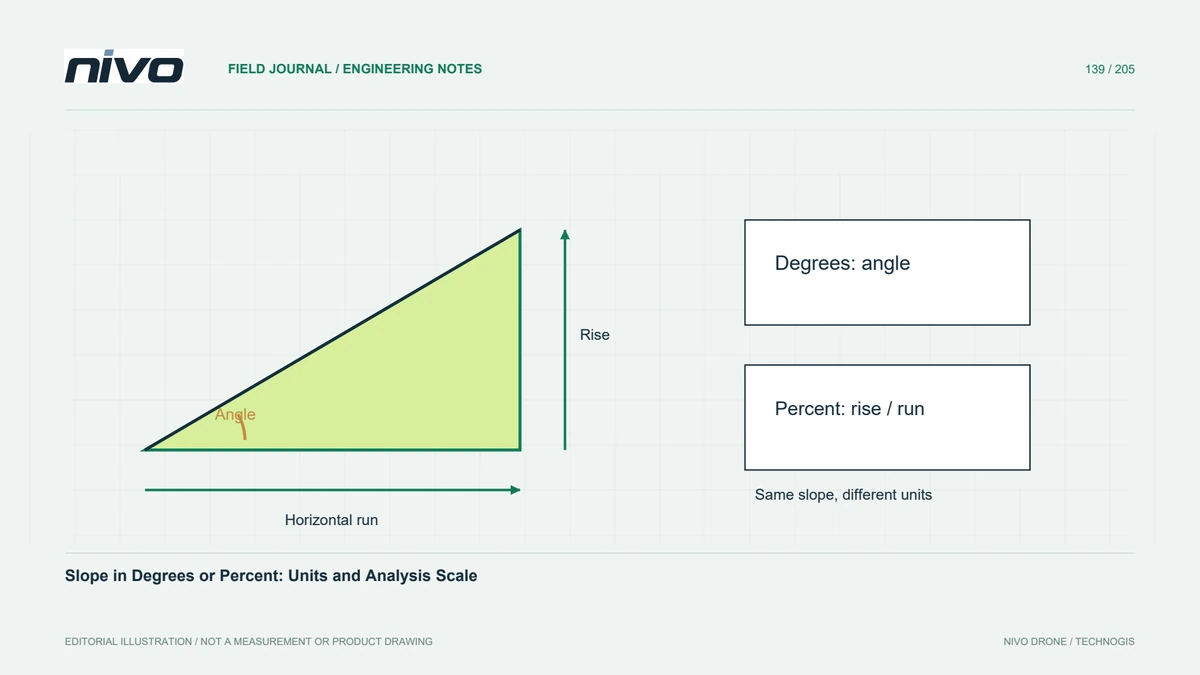
Degrees describe an angle, while percent slope expresses rise divided by horizontal run multiplied by one hundred. They are not interchangeable labels for the same number. A gradient can exceed one hundred percent without exceeding a right angle. Confirm which definition a design guideline or screening rule expects before classifying a drone terrain model or comparing it with another organisation's map.
Check coordinate and height units
Slope calculations depend on the relationship between horizontal spacing and elevation units. A raster with angular coordinates or mismatched height units needs appropriate handling by the chosen tool. Inspect the coordinate reference system and any vertical scaling options rather than assuming automatic conversion is correct. Test a simple known gradient so a unit mistake is detected before it spreads through the whole analysis.
Choose the surface that answers the question
A ground terrain model supports different questions from a surface model containing roofs and vegetation. Steep values around a building may describe the roof edge rather than the underlying land. Review ground classification, gaps, and surface treatments before interpretation. For a geotechnical screening task, a slope raster remains an input requiring professional context; it does not independently establish stability or an acceptable construction method.
Recognise the role of scale
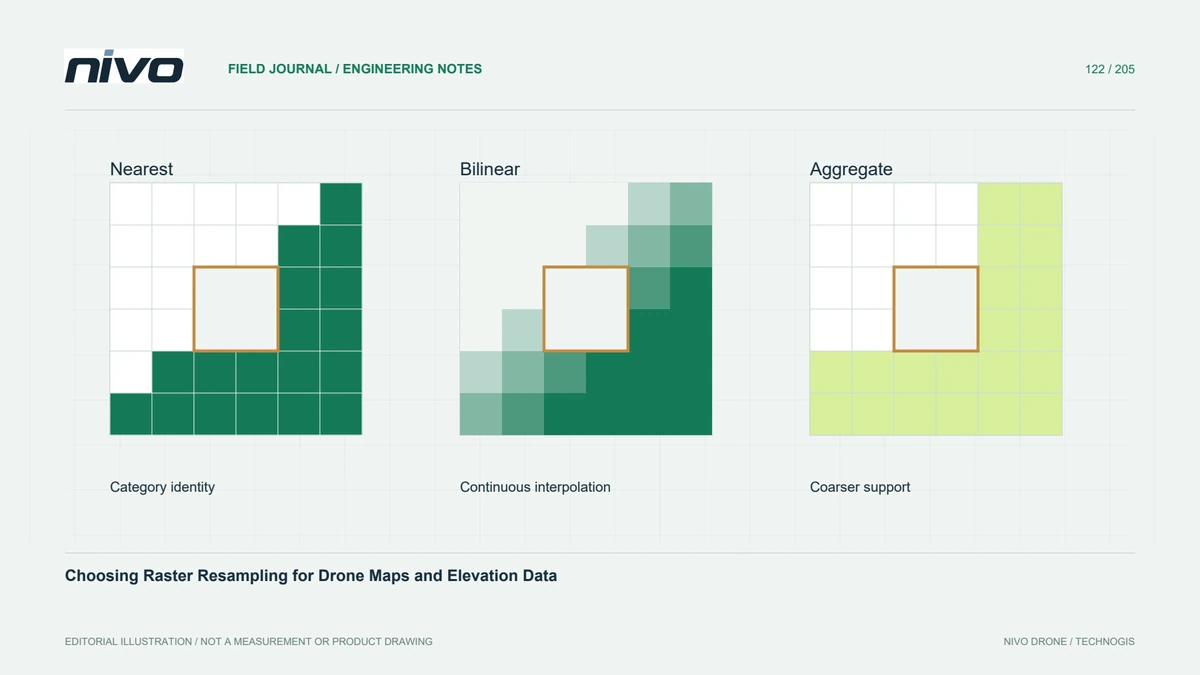
The derivative method and its neighbourhood influence the result. Fine-resolution data can reveal short, steep features and noise that a coarser grid averages away. Resampling a finished slope map is different from resampling elevation and recalculating slope. Compare methods at a documented analysis scale, especially when a threshold will divide a site into apparently precise classes for planning decisions.
Test a known profile and difficult edge
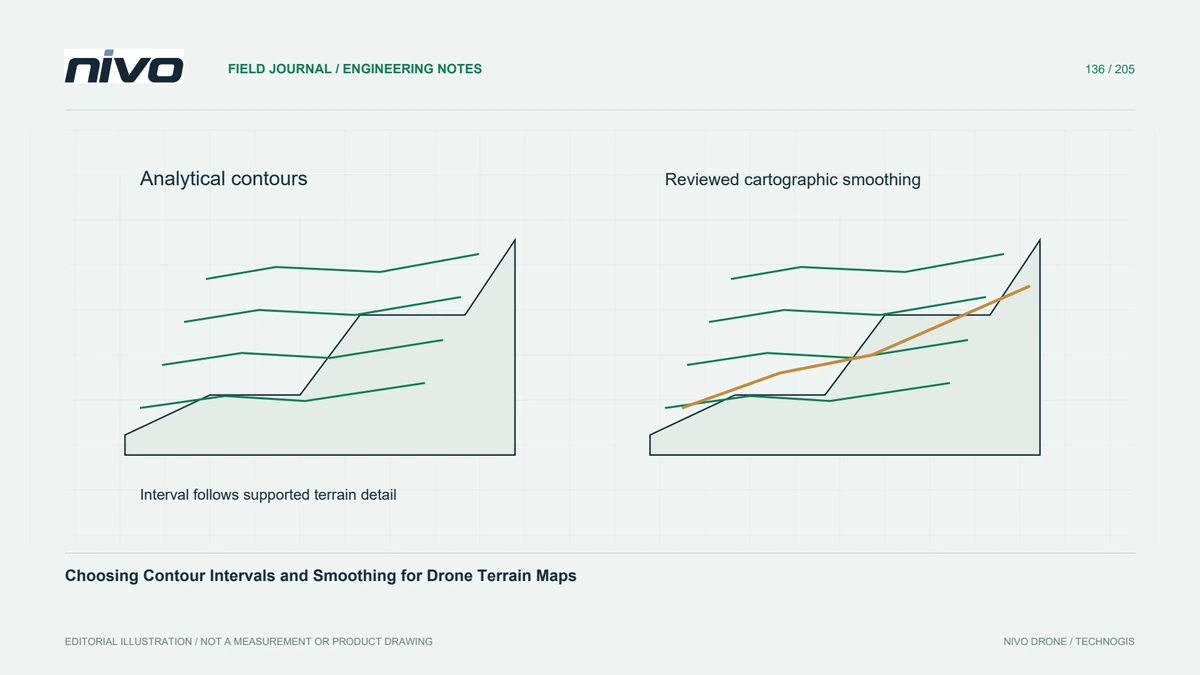
In a hypothetical access-road study, compare raster slope with profiles across a broad hillside and a narrow drainage bank. Check edge cells near missing data and inspect whether interpolation creates artificial steep rims. Evaluate candidate grid sizes against the features relevant to the route. Where a threshold boundary moves substantially under reasonable settings, report that sensitivity rather than presenting one coloured line as exact.
Deliver thresholds with their definitions
Deliver the surface version, units, algorithm, grid size, neighbourhood or relevant implementation settings, and class thresholds. Include the known-gradient test and representative profiles in the quality record. Acceptance should confirm correct unit interpretation and useful behaviour at the intended scale. Preserve continuous slope values alongside classes so later reviewers can revise thresholds without reconstructing the analysis from a flattened presentation image.