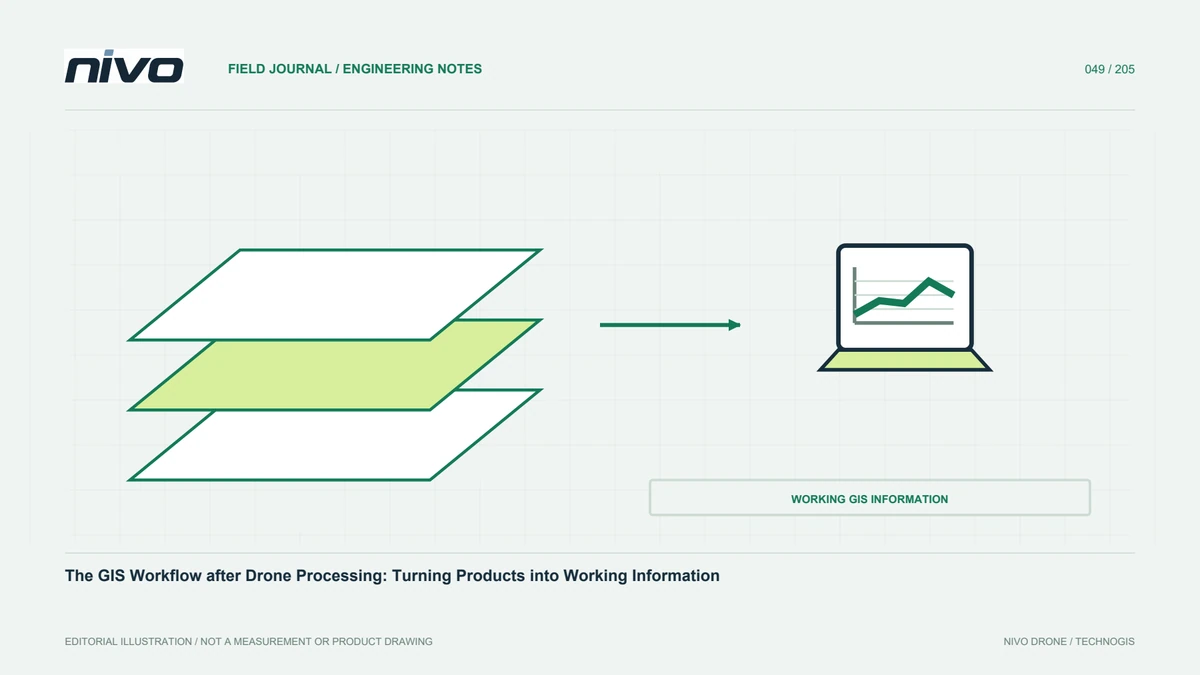
The GIS Workflow after Drone Processing: Turning Products into Working Information
Check references, structure rasters and vectors, manage attributes, validate analysis, and package maps so drone survey results become usable project information.
Inventory the products before using them
GIS work begins by understanding the delivered products. Orthomosaics, DSMs, DTMs, clouds, and meshes have different purposes. Record identity, date, references, resolution, and assessment for each. Read metadata before combining project layers. If surface meaning or testing limits are absent, ask rather than infer from a filename. This identifies reasonable analyses and missing information. The objective is not merely displaying aerial imagery, but organising observations into structured, meaningful data that teams can use consistently. An inventory also prevents a convenient preview from becoming the unnoticed source for measurements that actually require another product.
Check references before overlaying layers
Confirm source coordinate definitions and distinguish assigning a CRS from transforming numbers. Review units, heights, and relationships to project control. Software can display several references together through on-the-fly transformation without proving source definitions correct. Compare suitable references at distributed locations. Preserve source data and settings when reprojection is required, testing a sample before large raster operations. Early checks prevent positional problems spreading into digitising, area calculation, or terrain analysis. Those operations can run successfully while still relying on incompatible references, producing plausible numbers whose project meaning is wrong.
Organise rasters for efficient use
Aerial rasters can be large, so storage structure and reading performance matter. Appropriate tiling and overviews help without replacing the main analytical data. Label reduced or display-adjusted previews separately. Check NoData, bands, pixels, and valid coverage before deriving values. Preserve cropping and reprojection history, and avoid uncontrolled copies with similar names. Clear raster management lets teams find the necessary area quickly while ensuring calculations use an identified version with supporting metadata. Efficiency should improve access to information, not quietly alter which values or resolution users rely on for analysis.
Design vector structure before digitising
Define categories, attributes, unique identifiers, and geometry rules before creating features. Explain whether boundaries follow visible objects, administrative definitions, or supplementary measurements. Image quality does not automatically satisfy every boundary or design requirement. Use examples and rules for ambiguous areas so operators work consistently. Choose a format that preserves needed attributes and references in recipient software. Retain interpretation date and source where relevant. A planned schema reduces later repair and connects visible mapping with the information the project intends to manage, rather than leaving thousands of features whose meanings differ between operators.
Review attributes, geometry, and topology
Check missing values, unknown category codes, duplicate identities, and attribute units after digitising or import. Inspect invalid geometry and relevant topology, such as unintended overlaps or gaps. Do not apply automatic repair without understanding its effect. Preserve significant changes and test a sample first. For mixed dates or operators, review consistent definitions and detail. A tidy display can still conceal structural defects affecting analysis. These checks find problems before they propagate into area summaries, spatial selections, or integration with other records, where the source of an incorrect result may become harder to identify.
Match analysis to supported information
Area, distance, slope, volume, and change each require suitable sources and assumptions. Confirm that the chosen product represents the needed object or surface. Ground-slope analysis needs suitable terrain, not a surface raster still containing roofs and canopy. Preserve parameters, units, and valid scope. Review results against understandable locations and appropriate evidence rather than accepting a successful function run. Useful GIS analysis connects method to the user's question and relevant uncertainty. It should not imply greater confidence than observations support simply because the software offers a measurement tool or returns many decimal places.
Design maps for particular decisions
Field teams, managers, and technical reviewers may need different emphasis. Choose symbols, labels, scale, and summaries that help each find important information. Include sources, dates, references, and necessary limitations. Avoid crowding every layer into one display. Link locations needing review to identifiers in tables or detailed photographs. Visually separate observations from proposed work. A useful map carries analysis into action while retaining its connection to supporting data and assessment. Presentation choices should clarify the question rather than hide uncertainty or make planned elements appear to be measured site conditions.
Share a package that works after transfer
GIS projects link rasters, vectors, styling, and documents at particular locations. Use a portable structure and test it elsewhere. Include an index, metadata, and approved versions. If a portal or service is supplied, explain the distinction between online display and primary analytical files. Apply project access rules. Successful opening on the processor's workstation does not prove handover readiness. A destination test reveals broken paths, lost attributes, and application dependencies before users need the package for time-sensitive work, reducing avoidable delays and uncertainty over which files form the accepted project record.
A facility-inventory example
Use an orthomosaic for context, digitise facilities under an agreed schema, and add attributes from appropriate field checks. After reference and geometry review, summarise features by working area and present maps with tables. Use elevation only for questions its definition and quality support. Deliver metadata, main data, and a tested GIS project. NiVO acquisition supplies observations, while GIS provides structure for cross-team use. The result becomes an updateable part of project data management rather than a single image, with traceable relationships between observations, interpreted features, analytical results, and the decisions they support.
Illustrative scenario: turning a mosaic into a maintainable asset layer
Consider a hypothetical facility team that receives a good orthomosaic and asks several operators to digitise buildings and access routes. Without a shared schema, one operator assigns names freely, another uses numeric identifiers, and a third infers operational status from roof appearance. The GIS lead pauses production on a representative area rather than waiting until the entire site has inconsistent features. Required geometry, unique identities, attributes, and interpretation rules are agreed. Visible observations are separated from management facts that need another source. The map's coordinate definition is checked before any measurements or overlays become part of the working inventory.
The operators apply the schema to the same sample and review ambiguous boundaries together. Relevant topology checks identify unintended overlaps or gaps, while attribute checks find missing values and unsupported categories. Repairs are tested before being applied broadly so automatic geometry changes do not alter meaningful objects. Each feature can retain a source date and a link to appropriate supporting information. The team contrasts a visually attractive unstructured layer with a less elaborate but consistently defined dataset that can be updated and joined to other records. The latter better supports the agreed management task.
Handover contains the main vector data, a category dictionary, source references, and a tested GIS project with portable links. A recipient outside the digitising team opens it and follows a sample update. Questions exposed by that exercise are resolved before the workflow is treated as complete. This hypothetical case shows that aerial imagery becomes working information through references, definitions, evidence, and maintenance rules, not simply by drawing features over it. It also preserves a clear boundary between what the drone observed and what the organisation knows from its own records.