Zonal Statistics With Masks and Boundary Pixels
Choose cell-inclusion and weighting rules that match raster meaning, report valid coverage, and test small zones before summarising drone measurements by management area.
Define the quantity being summarised
A mean elevation, an average vegetation index, a count of classified cells, and a sum of per-cell quantities are different statistical questions. Identify what each raster value represents before selecting a zonal operation. A sum of pixel averages is rarely a meaningful total without an appropriate interpretation. Keep band selection, calibration status, units, and survey date explicit in the summary specification.
Choose a boundary-cell rule
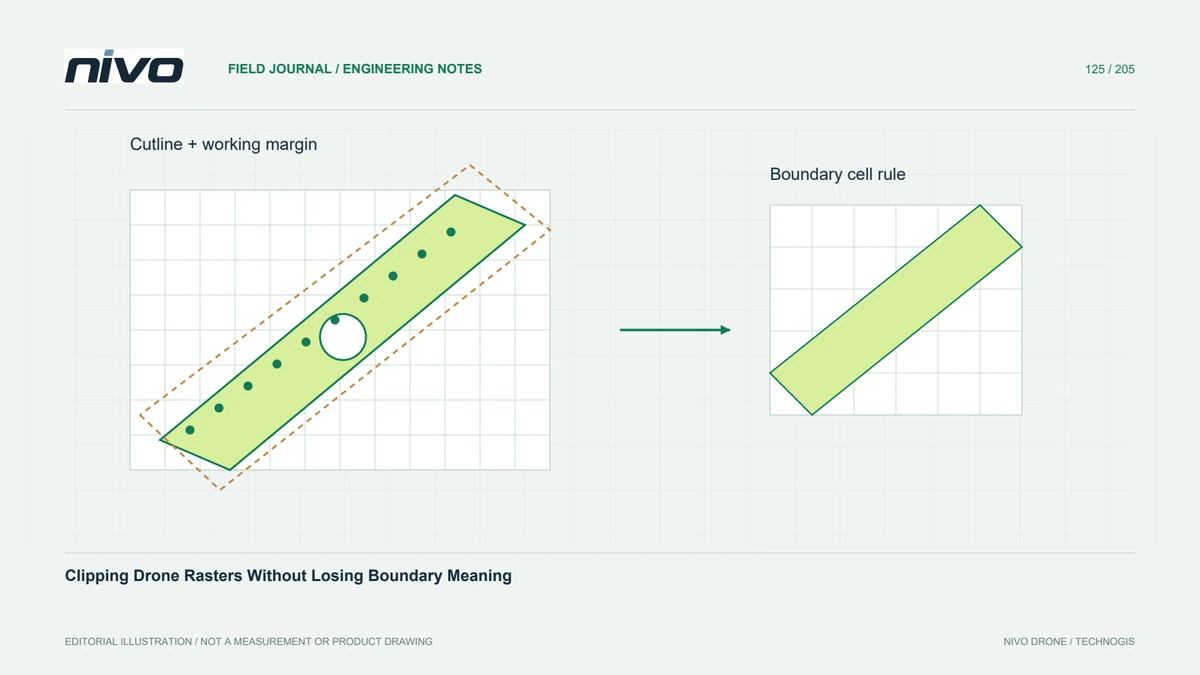
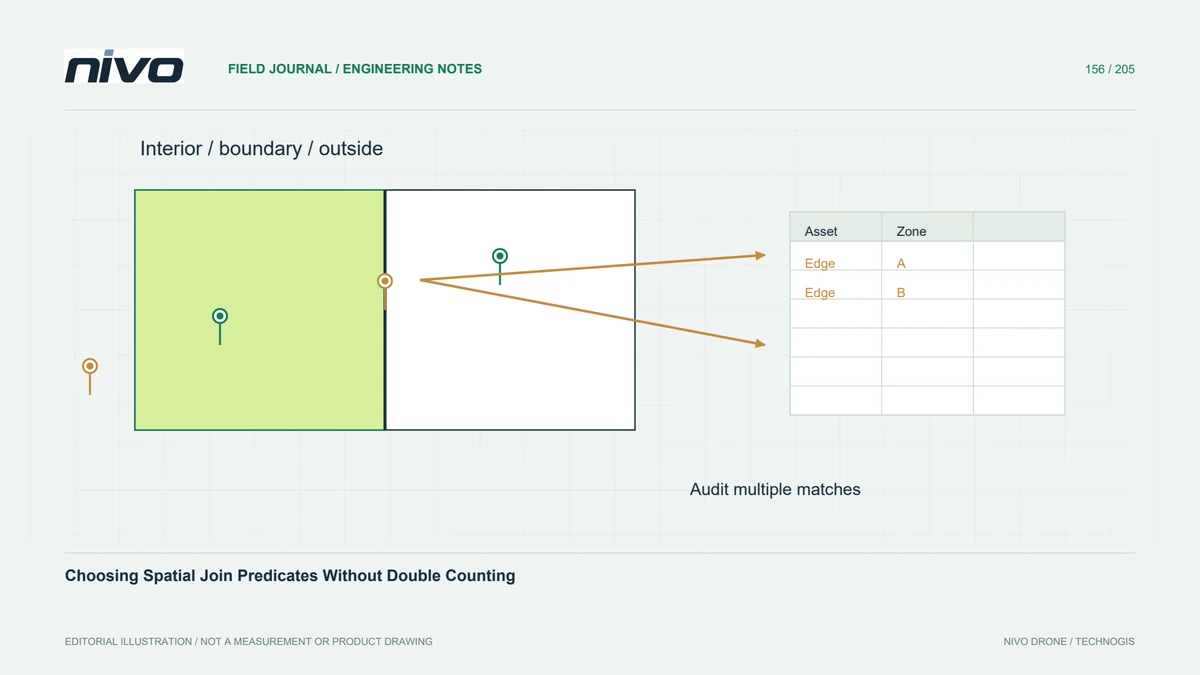
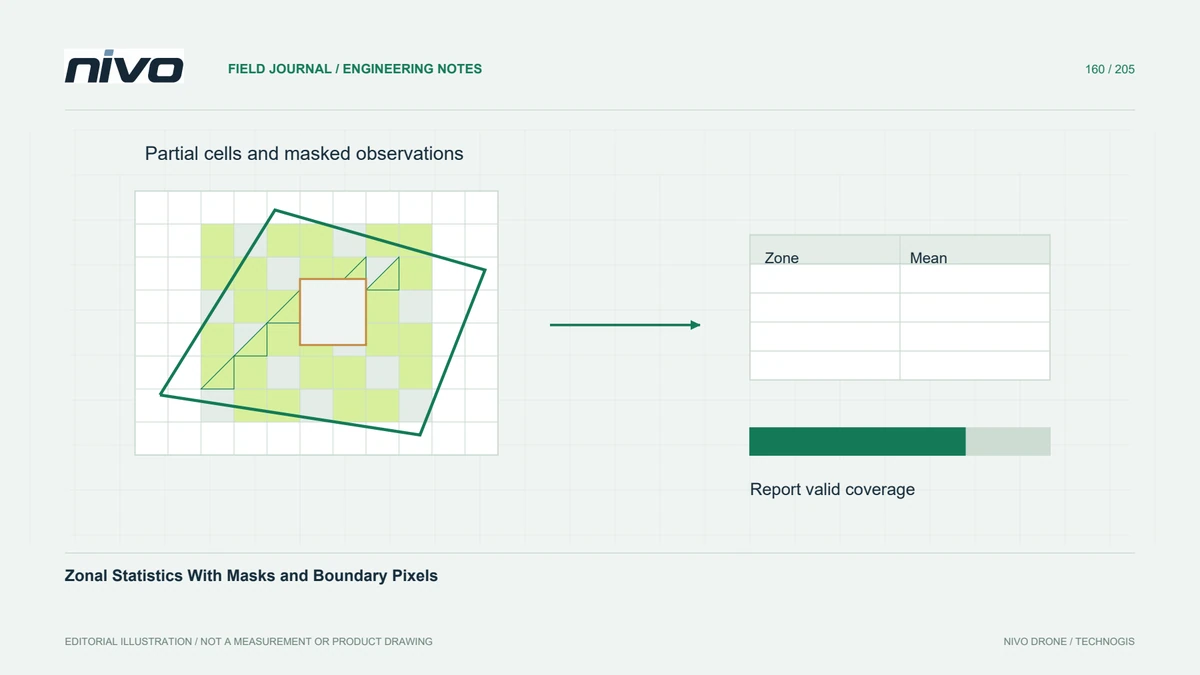
A polygon can intersect only part of a raster cell. Centre-based selection, all-touched selection, and fractional-coverage weighting can therefore produce different results. Choose the rule according to the task and software capability. Differences are especially important for narrow strips and small irregular zones. An apparently precise table may reflect the boundary convention more strongly than the variation in the underlying measurements.
Track valid coverage separately
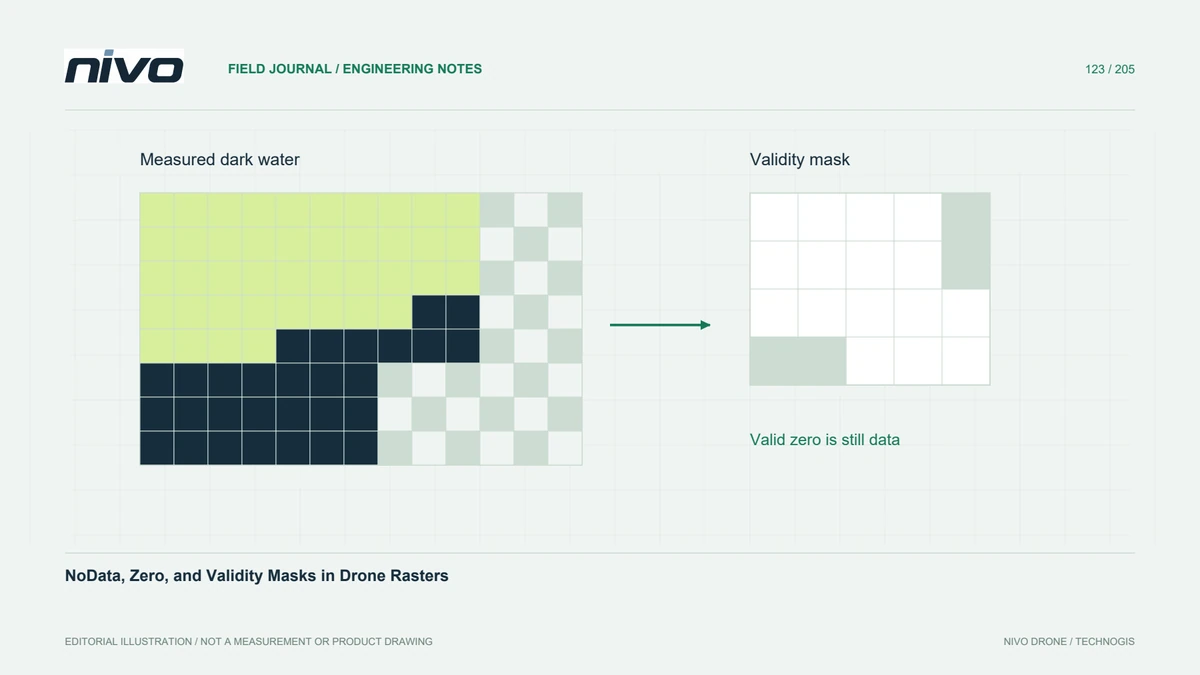
NoData cells should not silently become zero, and a zone with little valid coverage should not look equivalent to a fully observed zone. Report valid support, such as included area or a clearly defined valid fraction, alongside the statistic. Explain how masks and partial boundary cells contribute to that support. Establish a project-specific rule for withholding or flagging summaries with inadequate observations.
Match weighting to the physical meaning
Area weighting can suit continuous values representing conditions across cell footprints, while other quantities require different aggregation. A raster storing a total per cell differs from one storing a density per unit area. Confirm how the selected operation applies coverage fractions and additional weights. Reprojection into a geographic grid also raises cell-area considerations, so equal pixel counts need not imply equal physical area.
Check small and irregular zones
In a hypothetical crop-monitoring project, compare statistics for a broad field and a narrow headland crossing the raster grid diagonally. Hand-check a small window with known values, invalid cells, and partial overlaps. Inspect the effect of alternative boundary rules on the headland. If the difference matters to the management decision, document the chosen convention rather than presenting one software default as universally correct.
Deliver values with support information
Deliver polygon versions, raster band and date, mask policy, inclusion rule, weighting method, statistic definition, and support fields with the table. Preserve stable zone identifiers and clearly distinguish no result from a genuine zero. Acceptance should reproduce the hand-checked example and explain weakly supported zones. A zonal summary compresses spatial variation; retain the original raster so important within-zone patterns remain available for review.