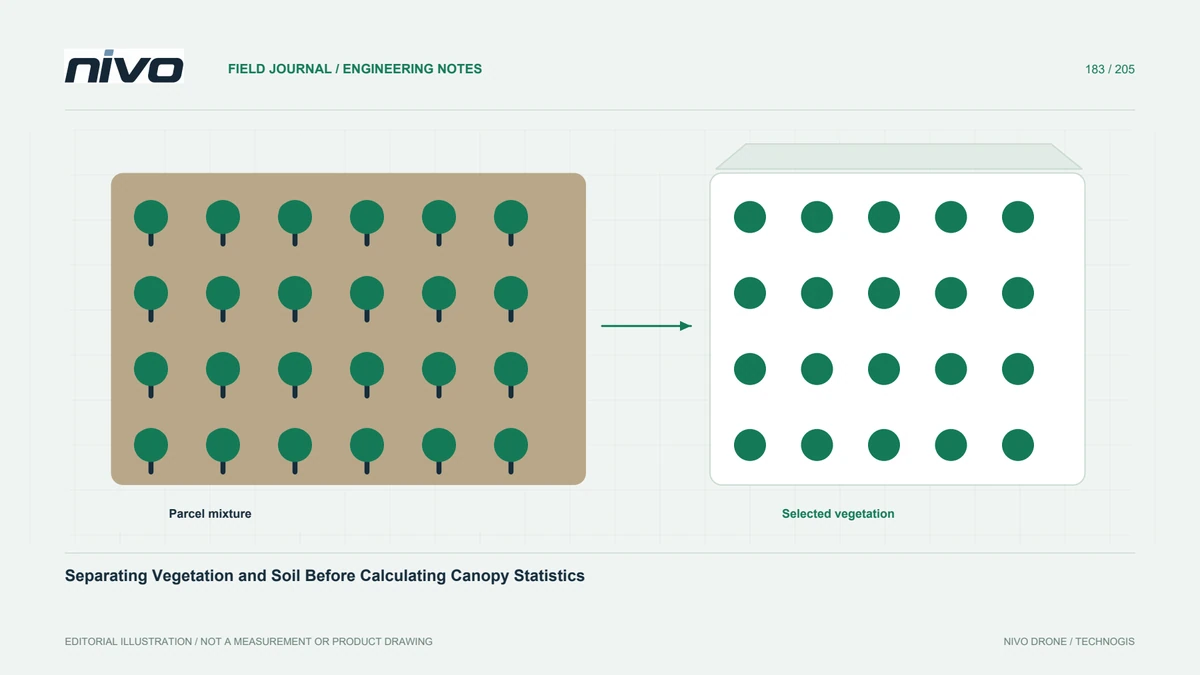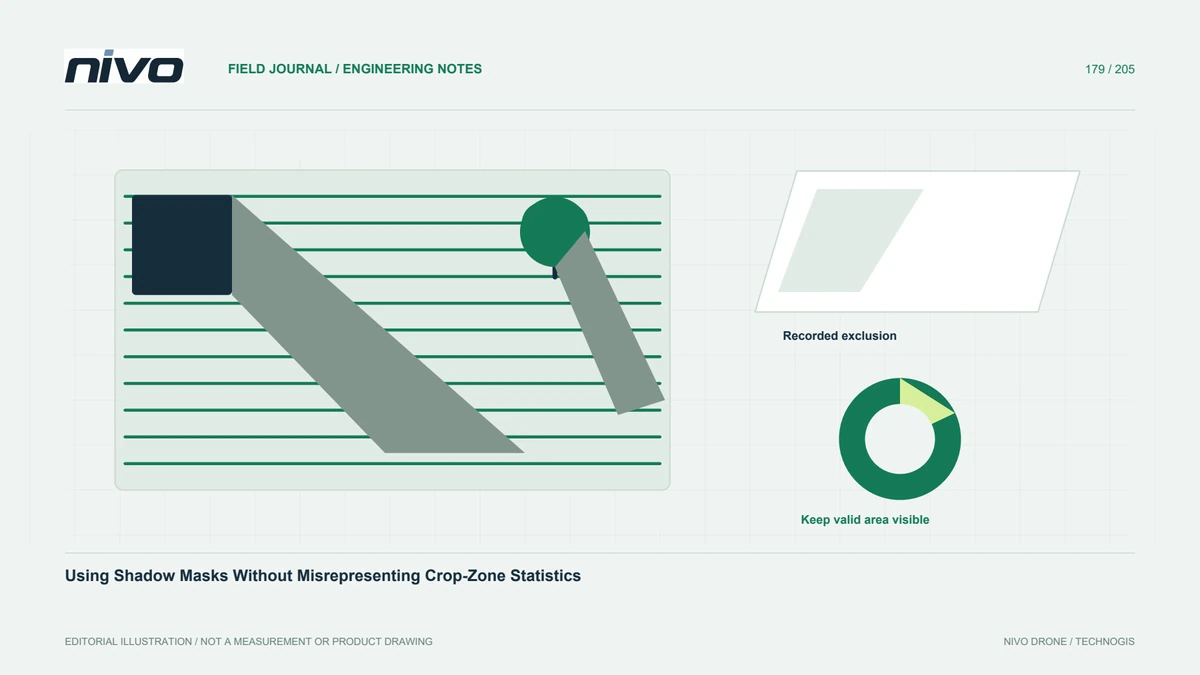
Field-Edge Mixed Pixels: Why Parcel Statistics Need a Boundary Review
Inspect boundary position, pixel composition, band alignment, and analytical support before interpreting crop-index differences along roads, drains, and neighboring parcels.
Identify the boundary question
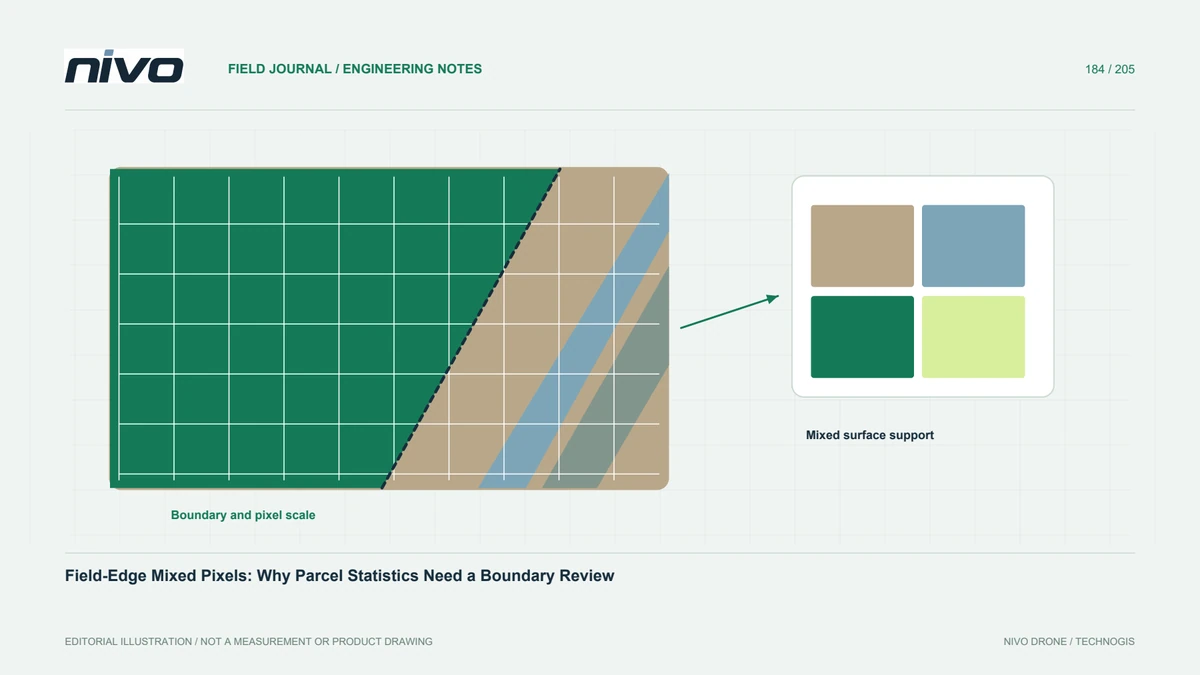
A narrow strip of unusual values beside a field can reflect real crop variation or a mixture of crop and neighboring surfaces. Establish whether the task concerns edge conditions or the interior canopy. Roads, drains, bare headlands, and hedges create different contexts. Do not discard every edge pattern as an artifact, but do not interpret it immediately as plant stress either. Start by defining the physical area the statistic is intended to represent.
Compare the boundary with current imagery
Check the parcel polygon against the current orthomosaic and representative source photographs. An old administrative boundary may not match the cropped area, and a visibly aligned polygon may still carry positional uncertainty. Preserve its origin and version. If the boundary is edited, document why and retain the earlier geometry. A small shift can change the surface mixture included in narrow zones, so silent editing can alter statistics without any biological change.
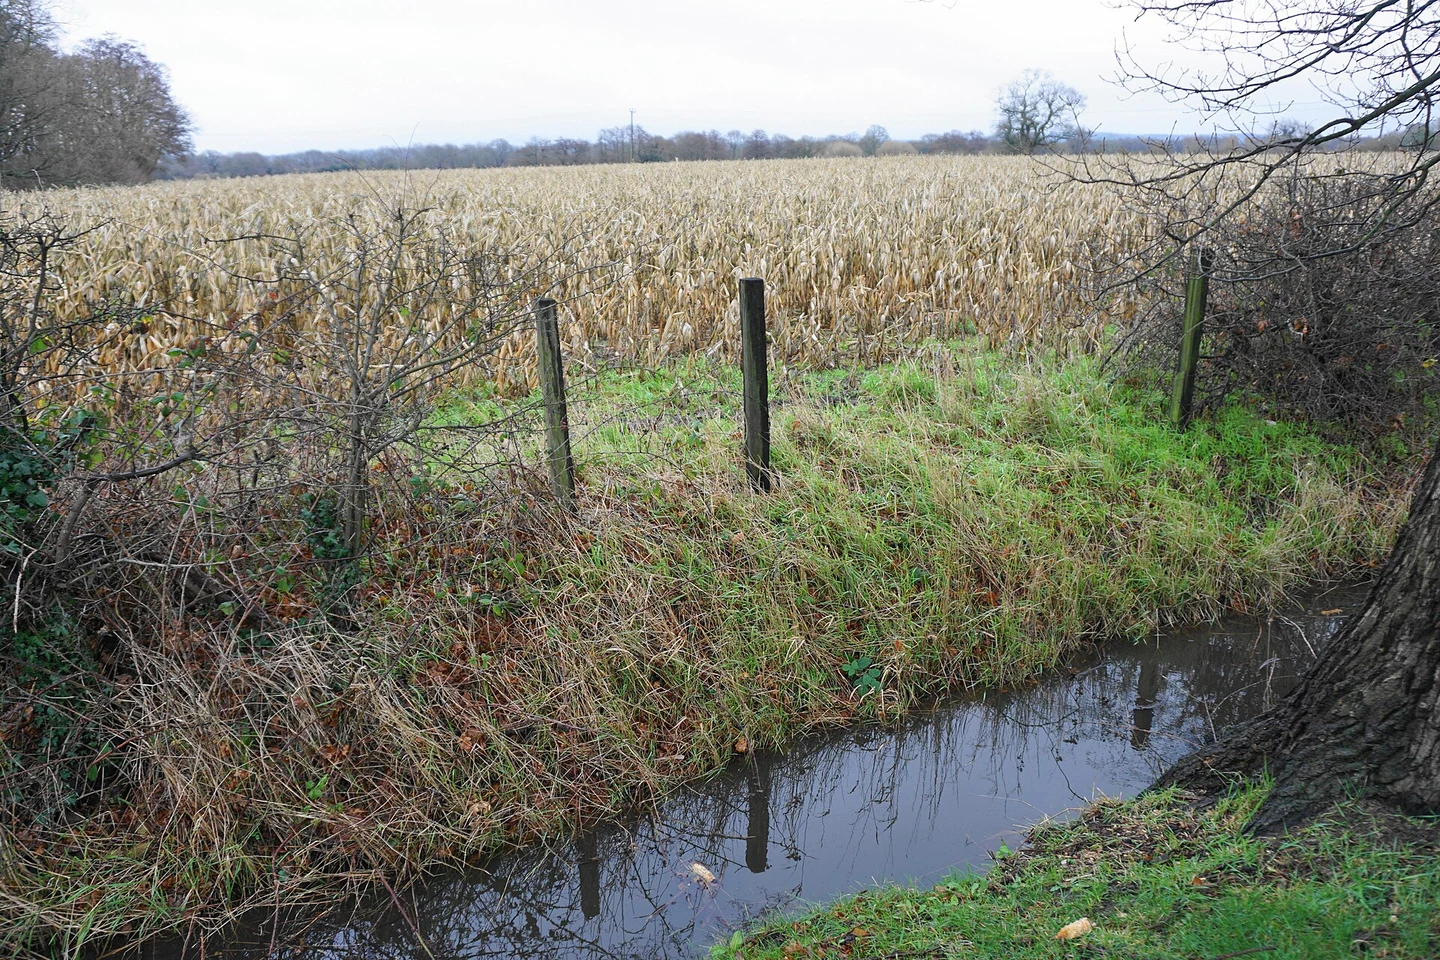
Review the actual pixel support
One pixel can represent a mixture of leaves, soil, road, or shadow. Resampling to a smaller grid does not separate those original contributions. Inspect the relevant sensor detail and processing history. Different bands also need suitable correspondence before an index is interpreted at a sharp edge. Where alignment or object size is inadequate, state that limitation. The problem is not solved by displaying the raster with smoother interpolation or drawing a more precise-looking line.
Test an explained analysis choice
Compare a whole-parcel result with a separately defined interior or edge zone when that distinction serves the question. Do not select an arbitrary exclusion distance and call it universally correct. Explain the basis in boundary uncertainty, image support, and intended interpretation. Preserve both geometries and the valid-area summaries. The test should reveal how sensitive the conclusion is to reasonable boundary choices, rather than choosing whichever option produces the preferred index average.
Check real edge conditions in the field
Include locations where imagery suggests a difference and nearby comparison areas. Record drainage, traffic, planting limits, shade, and other relevant observations without assigning an unverified cause. Some edge effects may be genuine and operationally important. Excluding them from an interior statistic does not make them disappear from the management record. Keep a separate finding where the edge question needs follow-up, with its source imagery and field observations linked clearly.
Make the statistic reproducible
Deliver boundary versions, analysis-zone definitions, raster references, mask rules, and affected areas. Explain whether a result describes all land within a parcel, the cropped footprint, or selected interior vegetation. For repeated monitoring, apply comparable definitions or describe why they changed. Bring difficult boundary examples to NiVO multispectral workflow consultation. The useful outcome is an interpretable statistic with visible spatial assumptions, not an apparently exact number whose meaning changes whenever a polygon or display grid is adjusted.