Recognizing Limited Index Sensitivity in Dense Crop Canopies
Investigate uniform-looking vegetation maps by separating display stretching, narrow numerical variation, canopy development, and the limits of index sensitivity.
Question a uniform-looking map
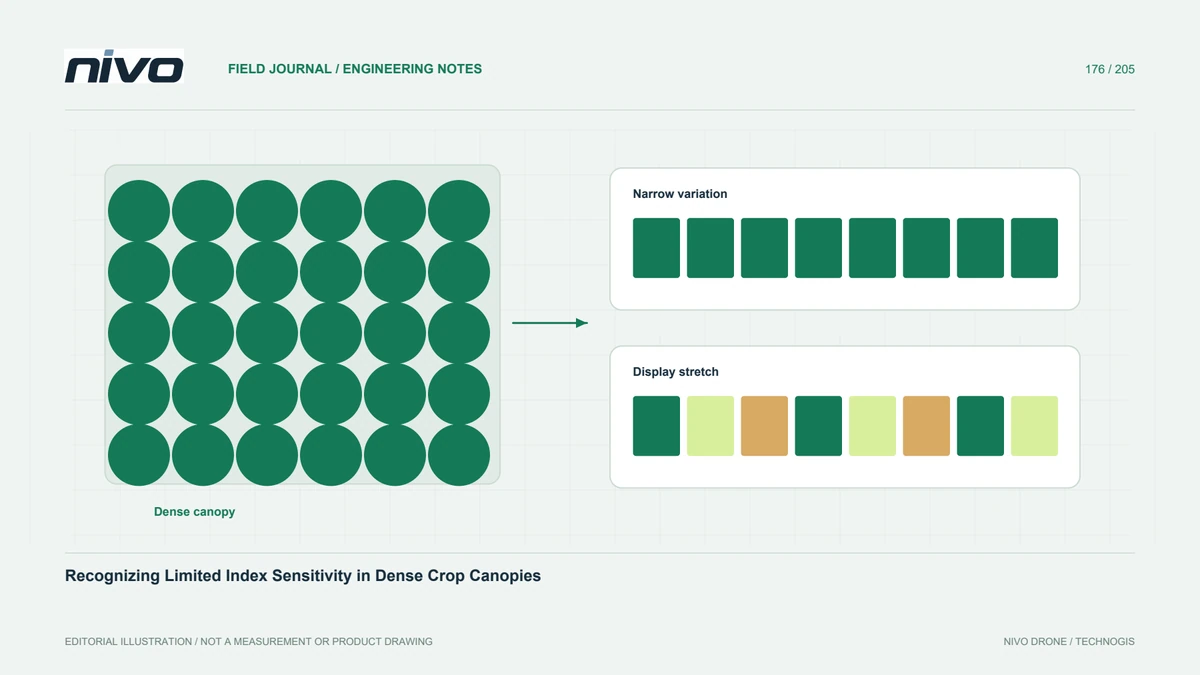
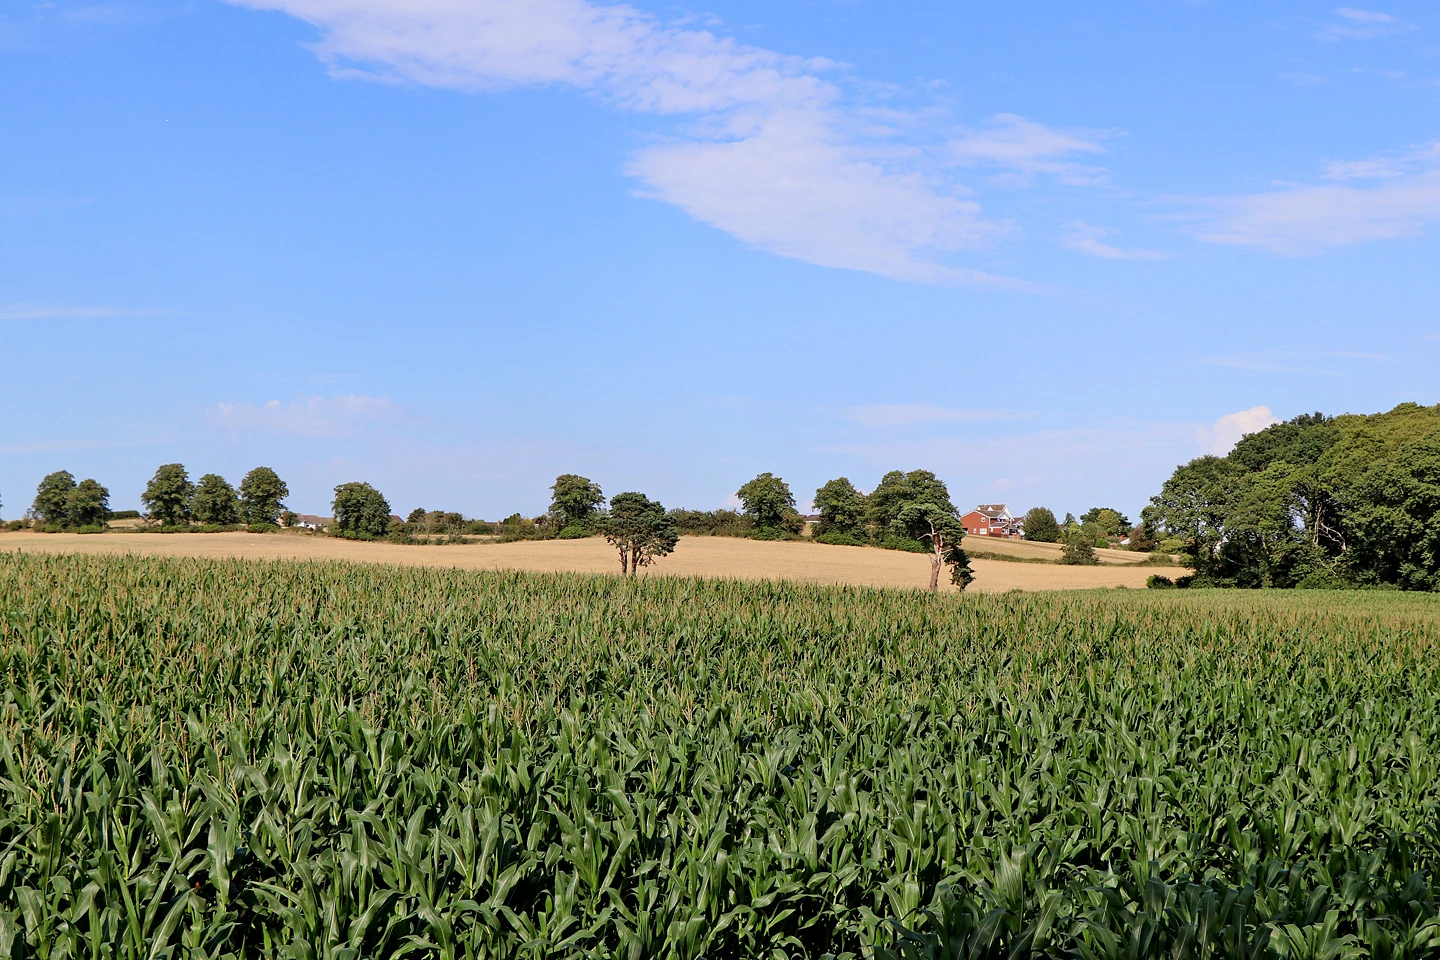
A field shown in nearly one color may be genuinely uniform, poorly styled, or represented by an index with limited sensitivity under those canopy conditions. Do not choose an explanation from appearance alone. Start with the numerical distribution and the observation question. MicaSense notes that NDVI can lose sensitivity at high canopy density. That principle supports investigation, but it does not prove saturation is the cause of every uniform map.
Review values before stretching colors
Inspect valid pixel values and summary statistics for representative areas. Record the display range and whether it is fixed or automatically stretched. A narrow range can be made visually dramatic without adding analytical information. Conversely, a broad legend may conceal a meaningful small difference. Keep the numerical and visual questions separate. The reviewer should be able to understand whether a striking pattern comes from measured variation or simply from how colors were assigned.
Check inputs and masks first
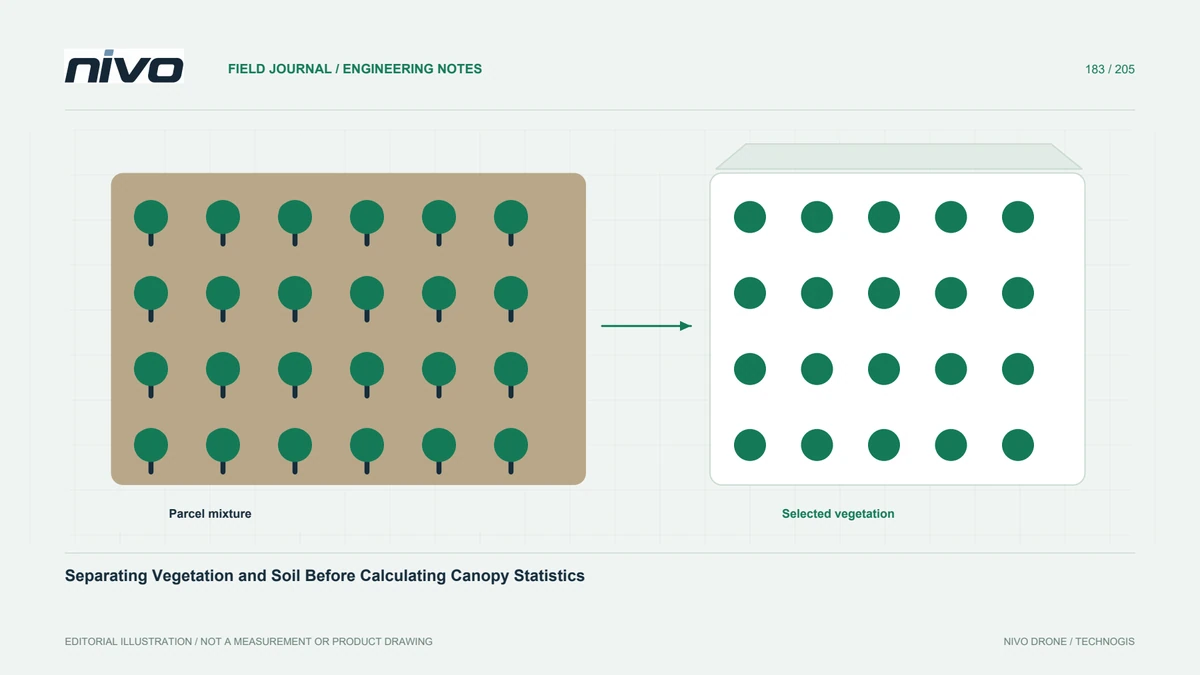
Verify band identity, alignment, correction, and the treatment of invalid pixels before interpreting canopy response. Exclude known processing defects through a documented method rather than adjusting the map until it appears plausible. Inspect RGB context and source imagery for shadows, exposed soil, or mixed cover. If the analytical input is unreliable, switching indices may only rearrange the error. Maintain a clear quality status for each area being compared.
Compare an additional observation
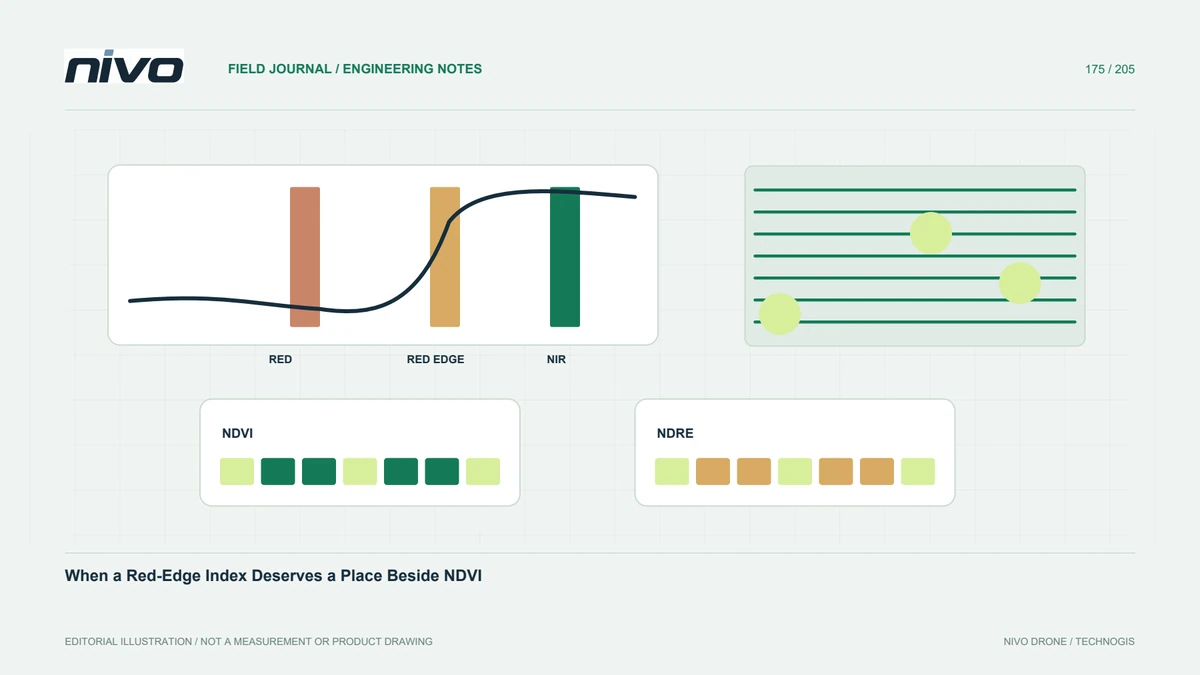
Where appropriate, evaluate another documented index or a different source of information, such as canopy structure or direct field observations. State what new question it can address. Red-edge information may be useful to investigate developed canopies, but it still requires model-specific bands and agronomic interpretation. Do not rank sensors by which produces the greatest color contrast. Compare evidence against the management decision and retain cases where the new layer adds little useful distinction.
Verify differences and apparent stability
Select field checks from both contrasting and apparently stable zones. Record crop stage, variety, management history, and relevant observations. If the field team finds differences absent from the map, examine whether they were observable by the selected sensor and index at that time. Do not automatically label the field observations or the imagery wrong. The disagreement may define a real boundary on what this particular analytical workflow can answer.
State the practical interpretation limit
Report where the index remains useful and where its response does not resolve the intended question. Avoid translating a high or stable index into a guarantee of crop health, nutrient adequacy, or yield. Preserve numerical summaries and styling rules with the output. In NiVO consultation, specify the developed-canopy question and verification plan rather than requesting a more colorful vegetation map. A useful specification accepts limitations and selects additional evidence only when it has a demonstrated purpose.