Mapping LiDAR Density to Reveal Ground Support Gaps
Measure local point support using explicit classes, grid areas, overlap rules, and edge treatment so a high overall density does not hide important terrain gaps.
Define which observations are counted
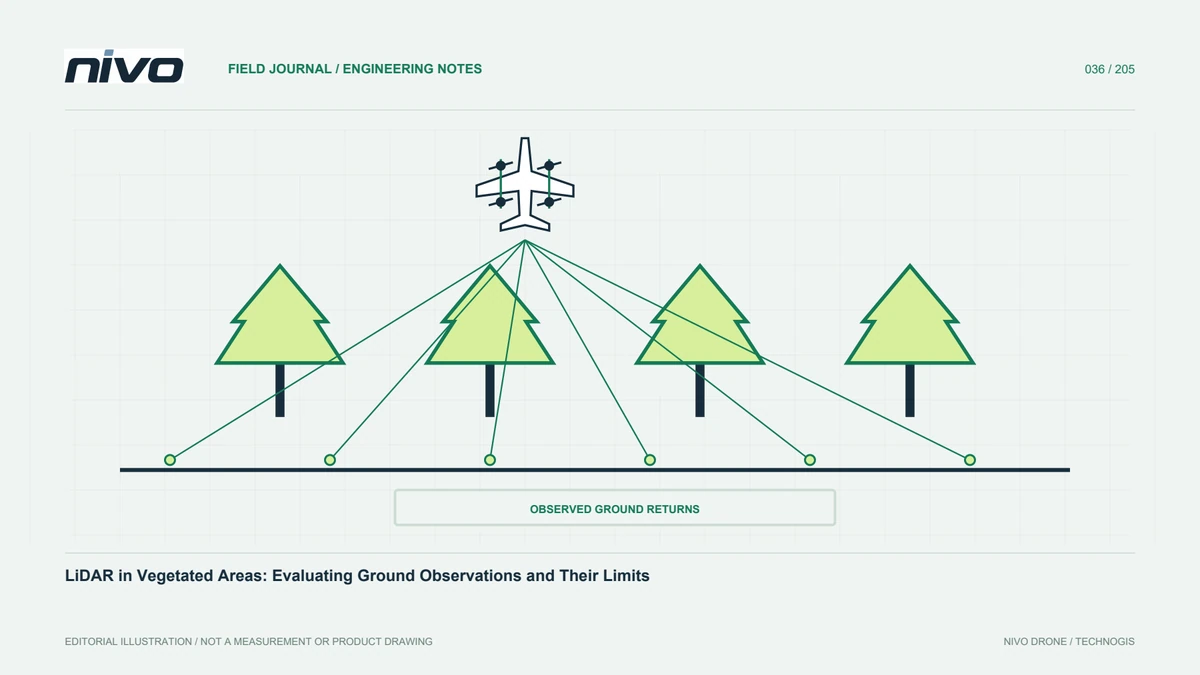
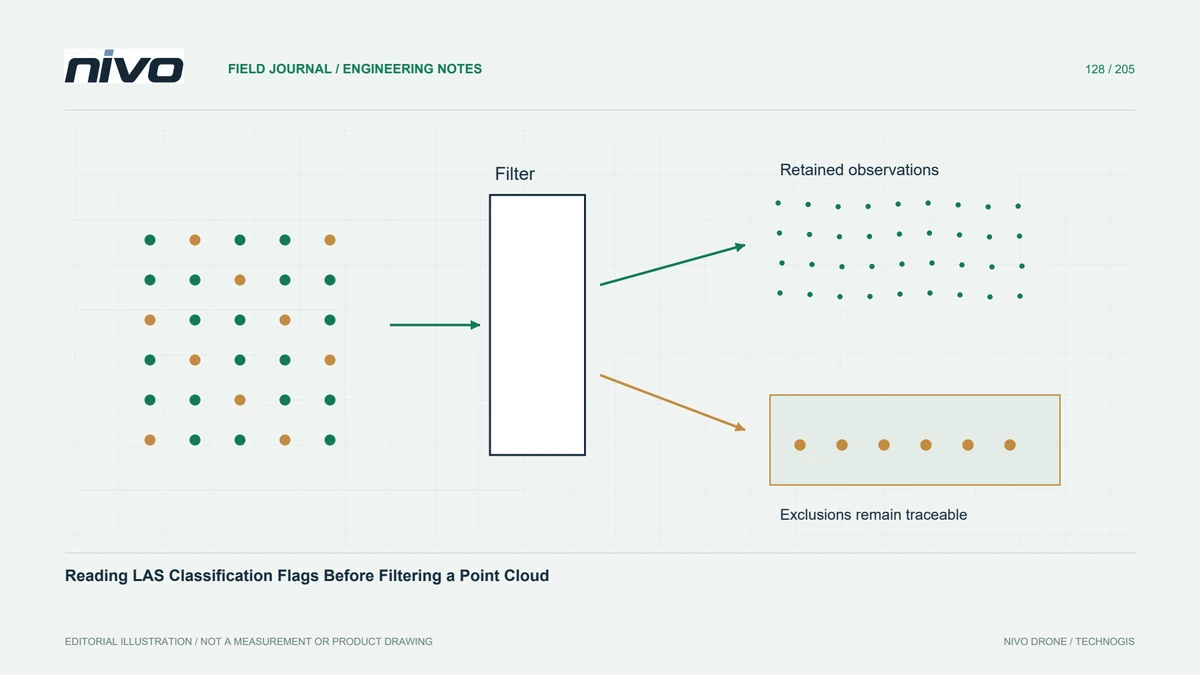
A point-density statement is incomplete without specifying what was counted. All returns, first returns, ground-classified points, and retained points after filtering describe different populations. Choose the population from the decision being supported and record the inclusion rules. Counting every return can demonstrate abundant observations above a forest while saying little about whether enough measurements actually support the ground surface below.
Select a meaningful analysis support
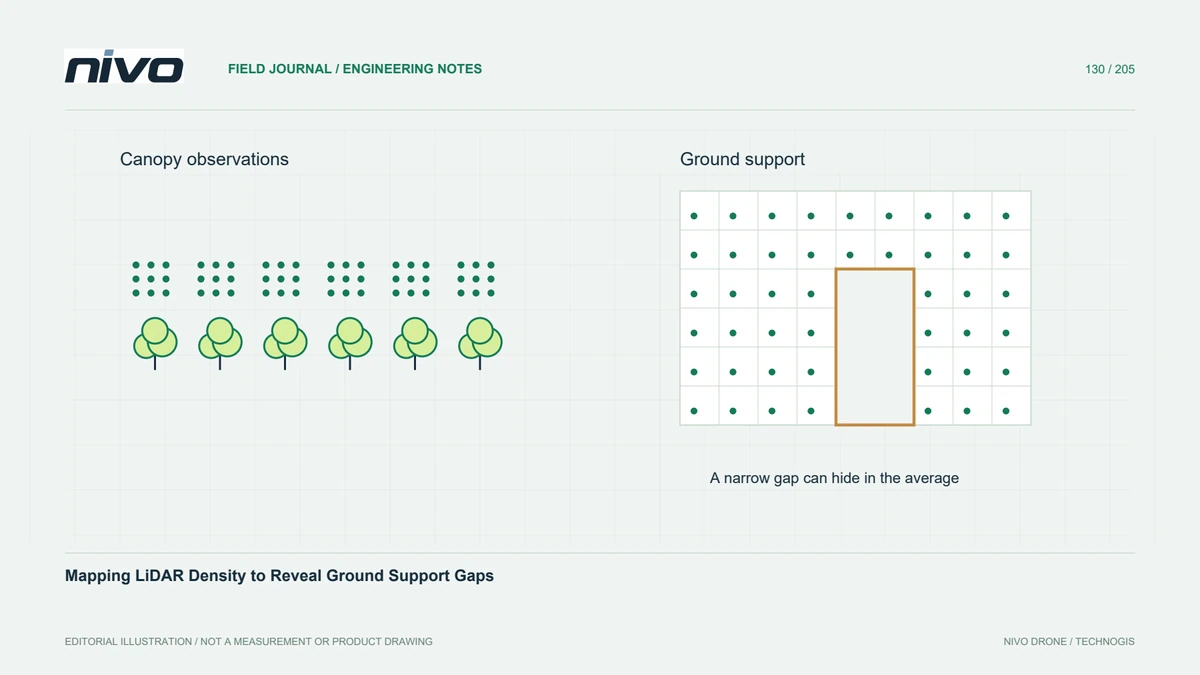
Density is usually summarised over a defined area, so the cell or neighbourhood size changes the apparent pattern. Small cells reveal local holes but may produce a noisy map; large cells can conceal a narrow unsupported channel. Use a projected coordinate system with appropriate area units and report the support size. Compare more than one scale when critical features vary substantially in width.
Separate ground support from canopy abundance
Prepare separate summaries for total retained points and the ground observations used in terrain generation. Their contrast can reveal where canopy abundance masks sparse terrain support. A classified point is still an interpretation that needs checking, so inspect profiles in suspicious areas. Neither a colourful density map nor a high average proves that the ground classification is correct or the elevations are accurate.
Handle edges and overlapping strips
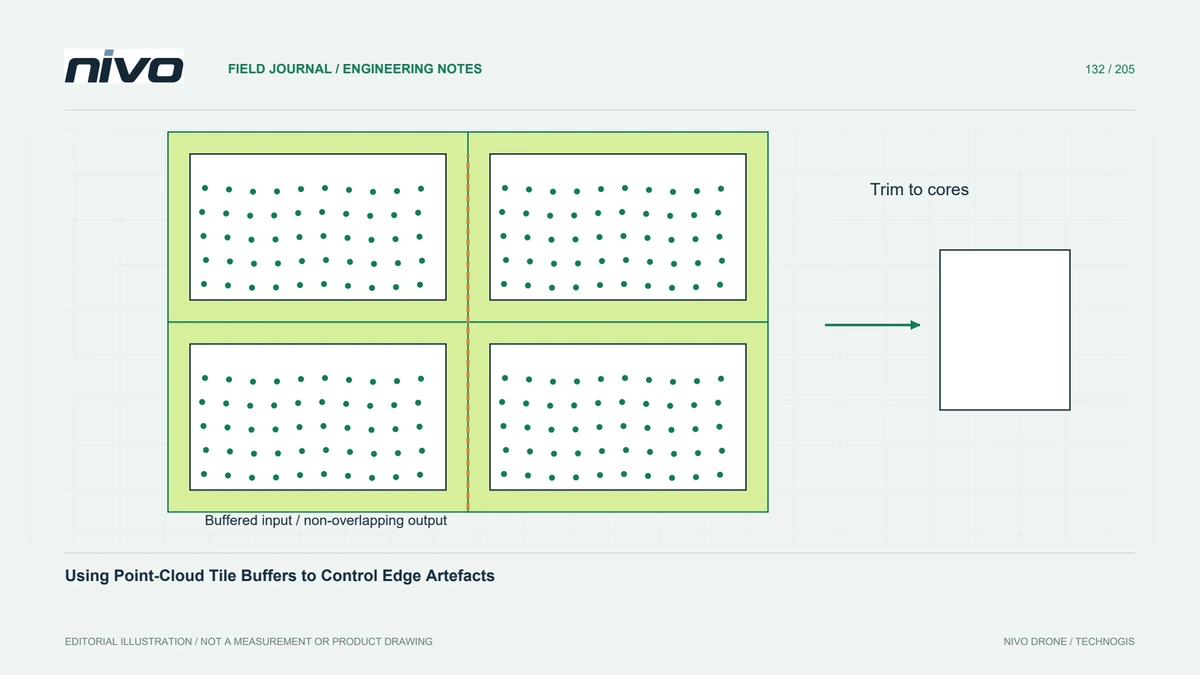
Dataset boundaries and overlap regions can distort simple comparisons. A cell partly outside observed coverage has a different effective area from an interior cell. Overlapping strips can inflate counts without improving spatial distribution proportionally. State whether duplicate or overlap observations are included, identify partial edge cells, and keep the counting method consistent when comparing blocks, dates, or alternative processing configurations.
Investigate low-density patterns
In a hypothetical plantation drainage project, examine low-support cells along shaded channels and beneath dense tree rows. Compare flight strips, ground profiles, and the interpolation footprint. Decide whether the issue calls for classification review, a larger uncertainty zone, supplementary measurement, or revised acquisition. Increasing interpolation smoothness may hide a gap visually while leaving the underlying evidence unchanged.
Report evidence with the terrain model
Deliver the density population, area support, thresholds used for review, and the source version alongside the terrain raster. Include selected profiles explaining representative weak areas and the action taken. Acceptance should focus on the features that matter to the project rather than a universal headline density. Preserve an explicit distinction between observed ground, interpolated terrain, and areas excluded from engineering interpretation.