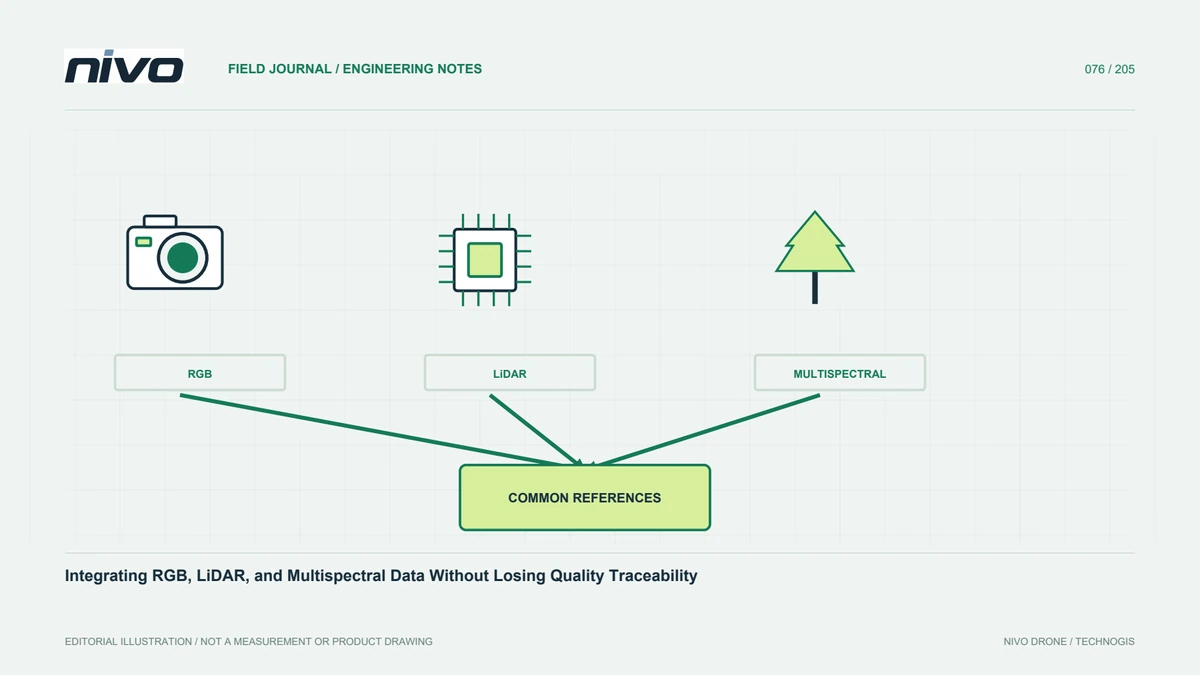
Integrating RGB, LiDAR, and Multispectral Data Without Losing Quality Traceability
Plan combined RGB, LiDAR, and multispectral analysis through defined questions, coordinate and time checks, sensible resolution, quality review, and source traceability.
Start with a question requiring several sources
Combining sensors adds value when each contributes information relevant to the question. RGB supports visual interpretation, LiDAR provides geometry through laser-return observations, and multispectral imagery adds selected spectral responses. Not every assignment needs all three. Identify the missing information and explain how another source helps the decision. Vegetation work might need canopy form and spectral patterns together, but detail and timing still require definition. Without a purpose, integration can become expensive layer accumulation whose benefit is difficult to explain to the recipient needing an operational answer.
Define each dataset's role and boundaries
State what each source observes and what it does not establish. RGB does not automatically supply information outside its recorded channels. A LiDAR point cloud is not automatically a terrain model; classification and processing remain relevant. A multispectral map does not diagnose crop conditions without context. Keep these distinctions visible when specifying outputs. Retain sensor identity, configuration, and processing methods. Defined roles guide appropriate checks and explain why layers might differ without assuming one is wrong or visually adjusting them until their appearances happen to agree.
Review coordinate and height references
Layers overlapping on a screen do not necessarily share equivalent references. Check coordinate systems, datums, units, elevation references, and transformations. Record control sources and sensor-position relationships. A file's projection name alone does not explain how the data were produced. Different georeferencing methods need comparison against suitable features or checkpoints. Report uncertainty. Reference differences can look like object changes, so resolve them before clipping, classifying, or combining values assumed to refer to the same ground location in the final analysis.
Consider observation time and changing conditions
Different acquisition dates can represent genuinely changed vegetation, moisture, construction, or material arrangements. Record timing and relevant conditions for every source. Matching boundaries do not make observations simultaneous. Where the question requires close timing, design for it or state the interpretation limit. Compare the value and cost of simultaneous and separate collection within confirmed integration capability. Do not assume a payload list means every combination can fly together on every aircraft. Time relationships belong to information design alongside spatial alignment and sensor selection.
Harmonize resolution without inventing certainty
Images and point clouds can have different detail and distribution. Resampling or aggregation onto one grid does not create information in the coarser source. Choose analysis units around the question and all inputs' quality. Explain the limiting layer and assess small targets affected by scale or summary methods. Do not select the smallest pixel simply because it looks sharper. Test representative areas and preserve parameters. An explainable resolution choice tells recipients which detail was observed and which comes from representation, interpolation, or aggregation.
Check each source before integration
Review RGB sharpness, coverage, and geometry; LiDAR completeness, strip consistency, classification, and positioning as relevant; and multispectral band alignment and value corrections. Combining unchecked sources can hide one problem beneath another and complicate diagnosis. Keep source-specific quality reports linked to accepted versions. A layer suitable only for visual context should not silently become a measurement reference. Strong integration retains the quality status of each input so that the combined conclusion rests on identifiable evidence rather than the convincing appearance of a multilayer display.
Explain the analytical relationship
Once space, time, and quality are reviewed, choose a relationship suitable for the question, such as parcel statistics or object-based inspection. Nearby patterns do not prove causation. Examine terrain, cover, capture circumstances, and other known influences. Use field samples to test interpretation. Retain methods and assumptions so the analysis can be repeated. A useful result explains the new information gained from combining sources and what supports that interpretation, rather than merely showing several datasets together without a defensible link to the intended decision.
Preserve provenance in the deliverables
Show each layer's source, date, method, detail, and use limits. Record versions and parameters behind combined statistics or classes. Allow findings to be traced to supporting images or points. Presentation can simplify communication without concealing unequal quality. Mark areas where a missing source restricts combined analysis. Distinguish direct observation, derived products, and interpretation. Clear provenance supports confidence and later improvements when new data or a better method becomes available, rather than forcing the next team to reconstruct how an apparently authoritative result was assembled.
Consult on payloads from the required output
Bring analytical questions, targets, extent, timing, reference requirements, and deliverables to NiVO consultation. Review installed mass, power, trigger, timing, and aircraft capability for the proposed RGB, LiDAR, or multispectral arrangement. Do not assume simultaneous integration from catalog availability. Build acceptance tests through final combination and output. Sensor decisions should follow project need and evidence. Integration creates value when different sources provide a stronger answer without concealing their respective limits, allowing the result to be understood, tested, and used for the actual decision.
Illustrative case: an apparent vegetation change created by misaligned sources
Imagine a hypothetical analysis combining an RGB orthomosaic, a LiDAR-derived surface, and a multispectral map. A narrow strip along a vegetation boundary appears different in the combined result, prompting a suggestion that the crop condition changed with elevation. Before interpreting that relationship, the analyst checks coordinate references, elevation definitions, acquisition dates, and actual spatial correspondence. The layers overlap approximately on the screen, but the comparison has not yet demonstrated that each value represents the same object. The team keeps the pattern as a question rather than immediately creating a causal explanation from visually adjacent colors and heights.
Independent checks and stable features are used to investigate the relationship between sources. Each dataset also retains its own quality record: image detail and coverage, relevant point-cloud checks, and multispectral alignment and correction evidence. If the sources differ in resolution, the analysis unit is chosen around the question and limiting information rather than simply resampling everything to the smallest pixel. A display grid does not add detail to a coarser source. Different acquisition times are documented because genuine field change remains another possible explanation. The team preserves the original layers and records any justified transformation or aggregation in a reproducible processing history.
Two decisions are compared: use the combined view as contextual visualization, or accept it for a defined quantitative relationship. The second requires additional evidence and must not inherit its authority from the first. Handover includes source versions, reference definitions, timing, chosen analysis scale, check results, and the uncertainty affecting the interpretation. Another analyst must be able to trace a result back to its contributing observations. This hypothetical case shows that useful sensor integration preserves the meaning and limits of each input instead of turning a visually convincing overlay into unsupported proof.